How to Collect and Visualize Windows Events From 5 Hosts in 5 Minutes
Overview
If you’re investigating incidents on your Windows hosts, sifting through the Event Viewer can be a painful experience. It’s best to collect and ship Windows Events to a separate backend for easier visualization and analysis – but depending on your chosen solution, this can take some significant legwork. This can often require manually configuring a 3rd party tool or agent to get started.
In this post, I will walk through just how easy it is to collect, parse, and visualize Windows Events from multiple Windows machines with observIQ – all in less than 5 minutes – without needing to set up any 3rd-party tools. No digging around in configuration files to specify log formats or parsing rules – no need to stand up your backend and storage.
Whether you’re an enthusiast, ITOps, or DevOps professional, observIQ provides tools to collect, parse, and analyze Windows events faster and easier than any other solution.
Before We Start: A Few Simple Pre-Reqs
1. Sign up for an observIQ Cloud Trial
First, sign up for an observIQ Cloud free 14-day trial – no credit card is required.
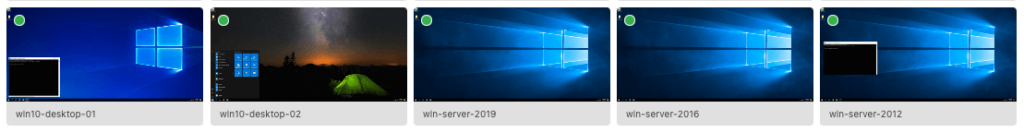
2. Choose Your Windows Machines
Next, could you assemble the list of Windows machines you want to monitor? These can be Windows 10 workstations or servers, ranging from version 2008 – 2019.
3. Verify Your Access
For the selected machines, verify you have both Administrator privileges and RDP (Remote Desktop) access for any remote machines – you’ll need both to install the observIQ log agent.
That’s it! Now, we’re ready to proceed.
Install observIQ Agents on Your Windows Hosts: A Few Simple Steps
To begin, log into your newly-created observIQ account and follow the three simple steps below:
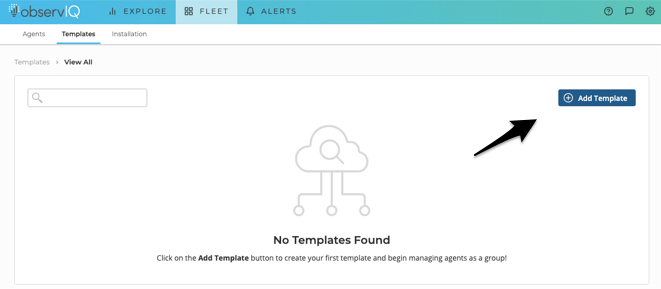
1. Create a Template
Time: [1 minute]
The first thing you’ll need to do is create a Template in observIQ. Navigate to the Fleet > Templates page and click Add Template.
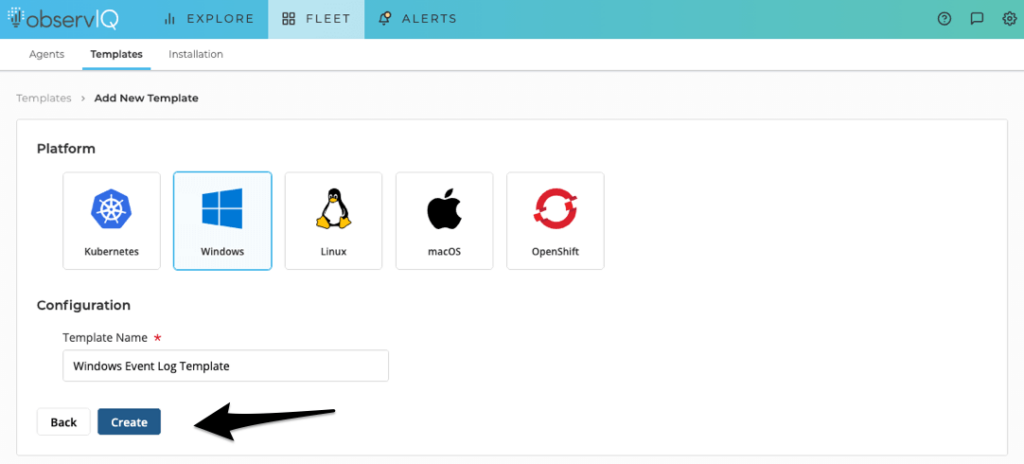
On the Add New Template page, select Windows as the platform and provide a friendly name for your Template. In this case, we’ll call it something simple: Windows Event Log Template. Next, click Create.
2. Add a Windows Event Log Source to Your Template
Time: [1 minute]
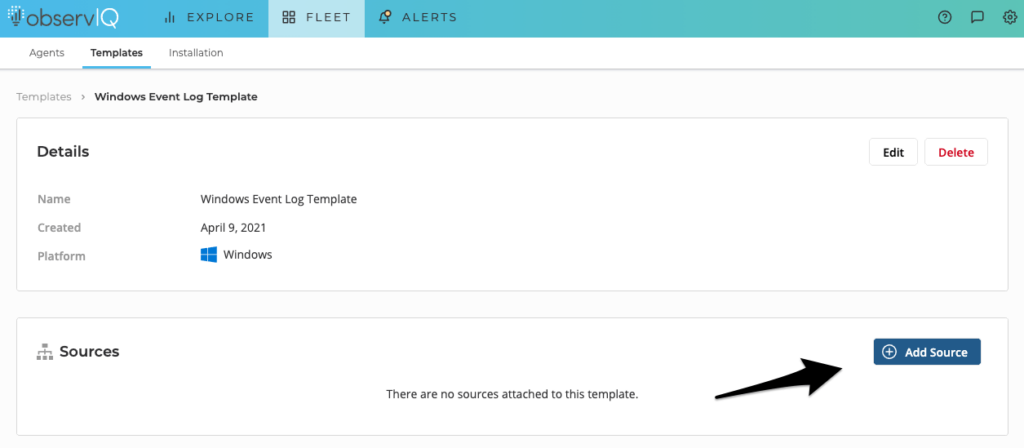
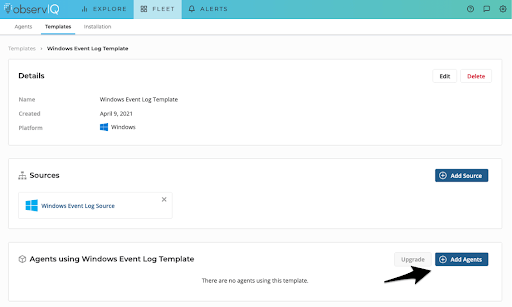
Next, you’ll be taken to your newly-created Windows Event Log Template. From here, we’ll add a Source to our template. Click Add Source.
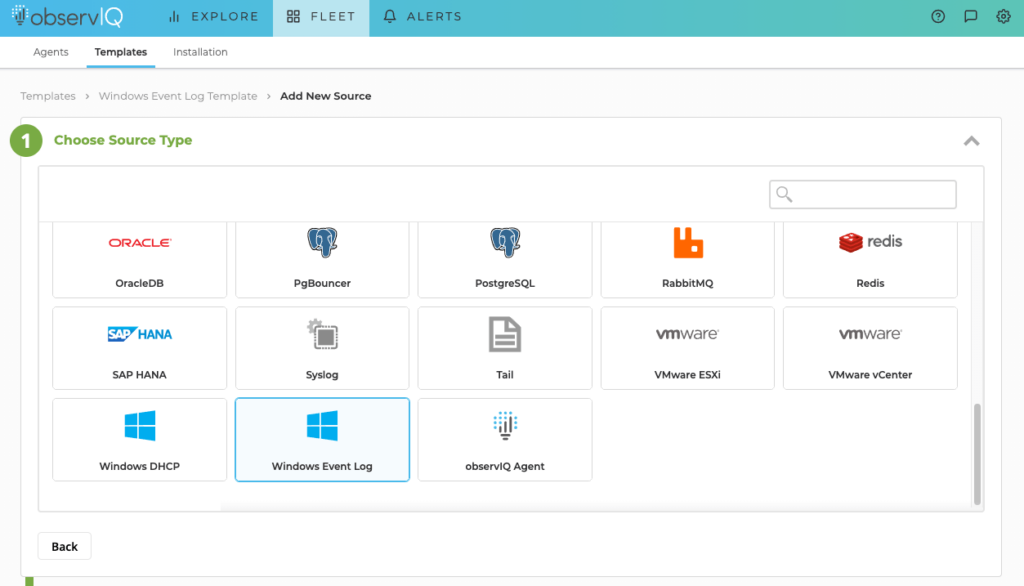
Search for Windows Event Log in the list on the Choose Source Type page.
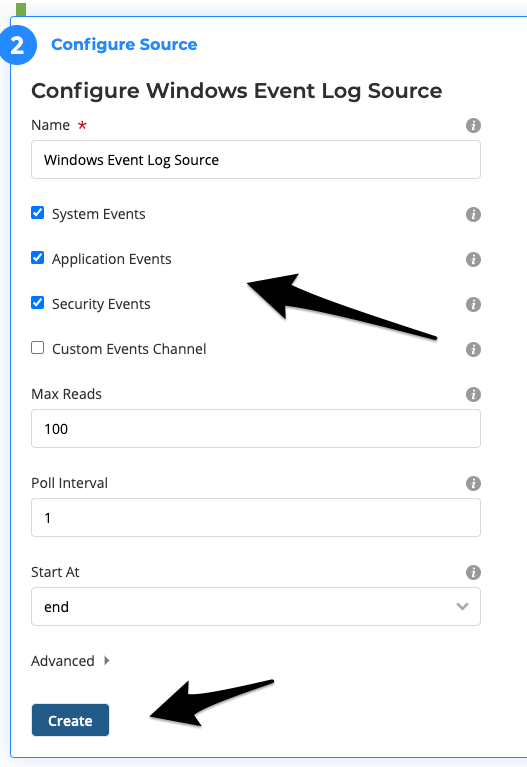
Please provide a friendly name for your Source on the Configure Source panel. Again, we’ll name it something simple: Windows Event Log Source. Then, choose the event channels you’re interested in collecting events from. For this example, let’s leave the three default selections for System, Application, and Security, as these are typically the most important channels to monitor.
3. Install the observIQ Log Agent Using a One-Line Installation Command
Time: [3 minutes (30 seconds per Windows host)]
Next, click Add Agents to generate a one-line agent installation command.
Could you copy the one-line agent installation command to your clipboard?
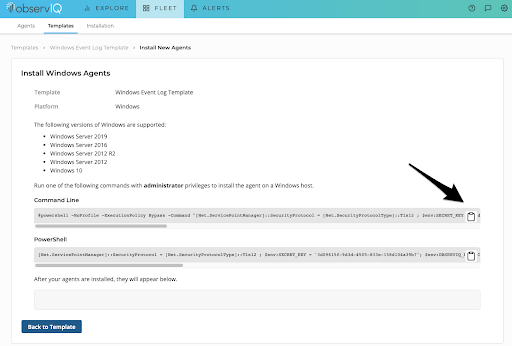
Now, we can install the observIQ log agent on each Windows host. Simply RDP into each system, open the CMD Prompt as an Administrator and paste and run the command. The necessary installation files will be downloaded automatically on your Windows machine in 5-10 seconds.
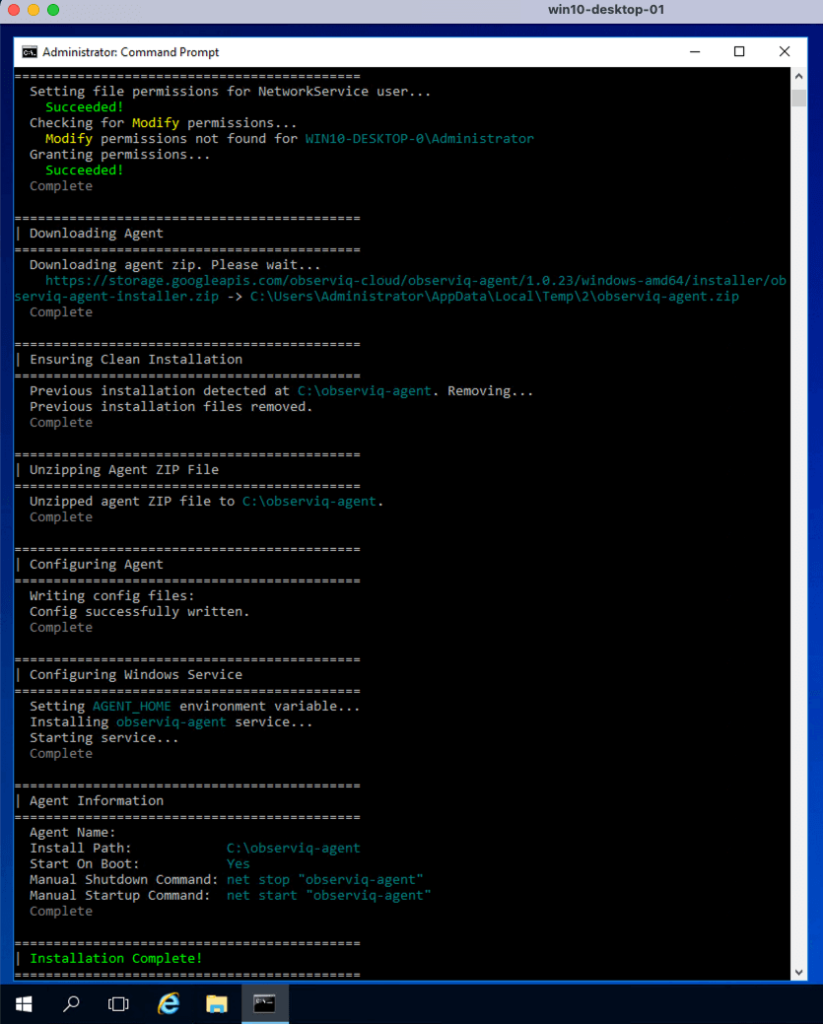
As each installation succeeds, the agent will be automatically detected by observIQ and associated with your Template. Configuration is complete!
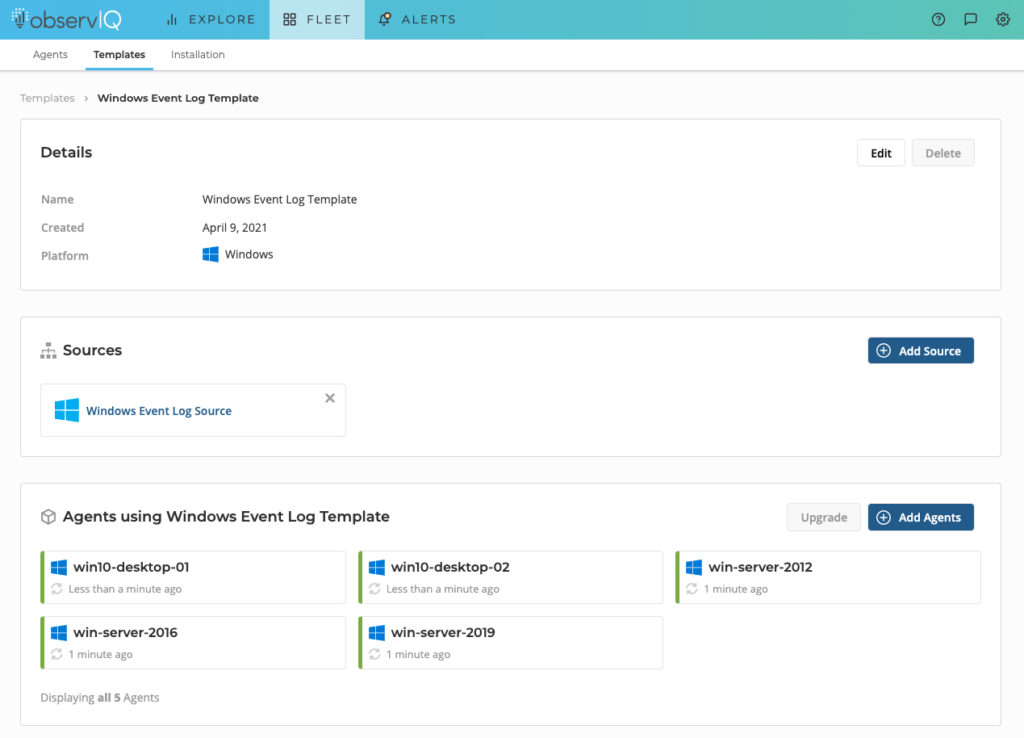
Now, you have the observIQ log agent installed on your machines. Each agent collects and parses the Windows Events based on options we’ve selected (Application, System, Security) in our Windows Event Log source that we’ve added to our Template. Let’s take a look.
Exploring Your Windows Events Discover Page
Return to the Explore > Discover page in observIQ. You’ll now see Windows Events flowing into your account. In the Type column, you’ll see logs from the three channels we selected in our Source, the severity, and a summary of the event.
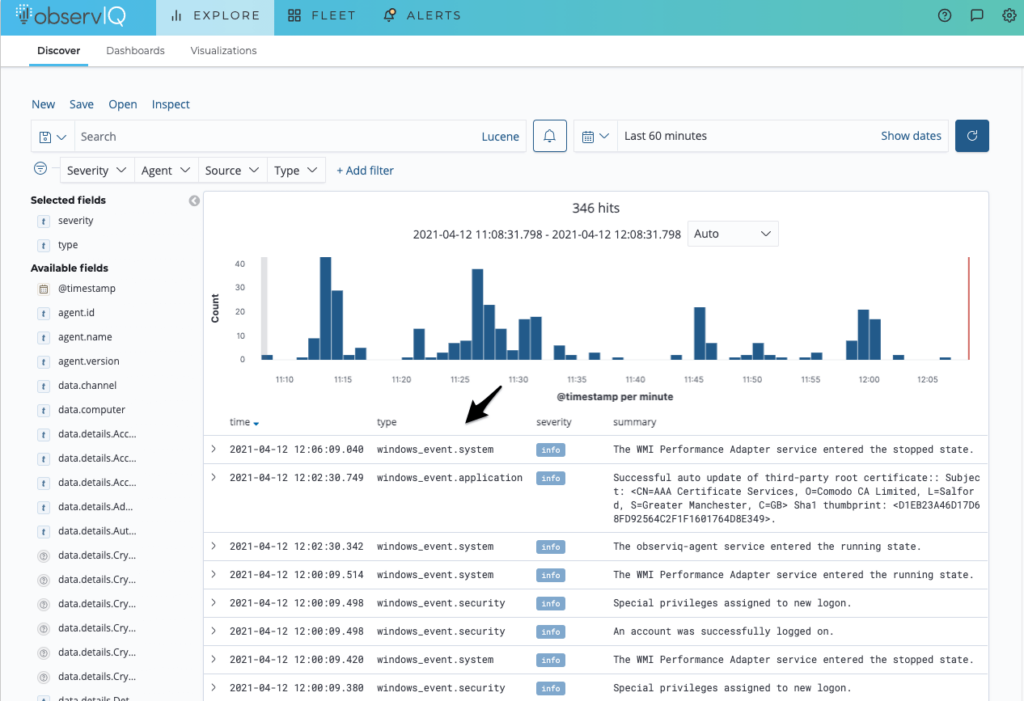
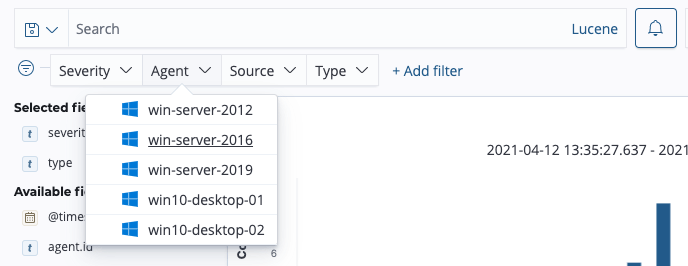
To quickly sort through your logs, you can use observIQ’s dynamic filter bar to filter your events by severity, agent, source, or type.
Dashboards
When we created our Windows Event Log Source, Windows Event dashboards were automatically deployed to this account: one for application and system events – and one for security events. You can find them on the Explore > Dashboards page.
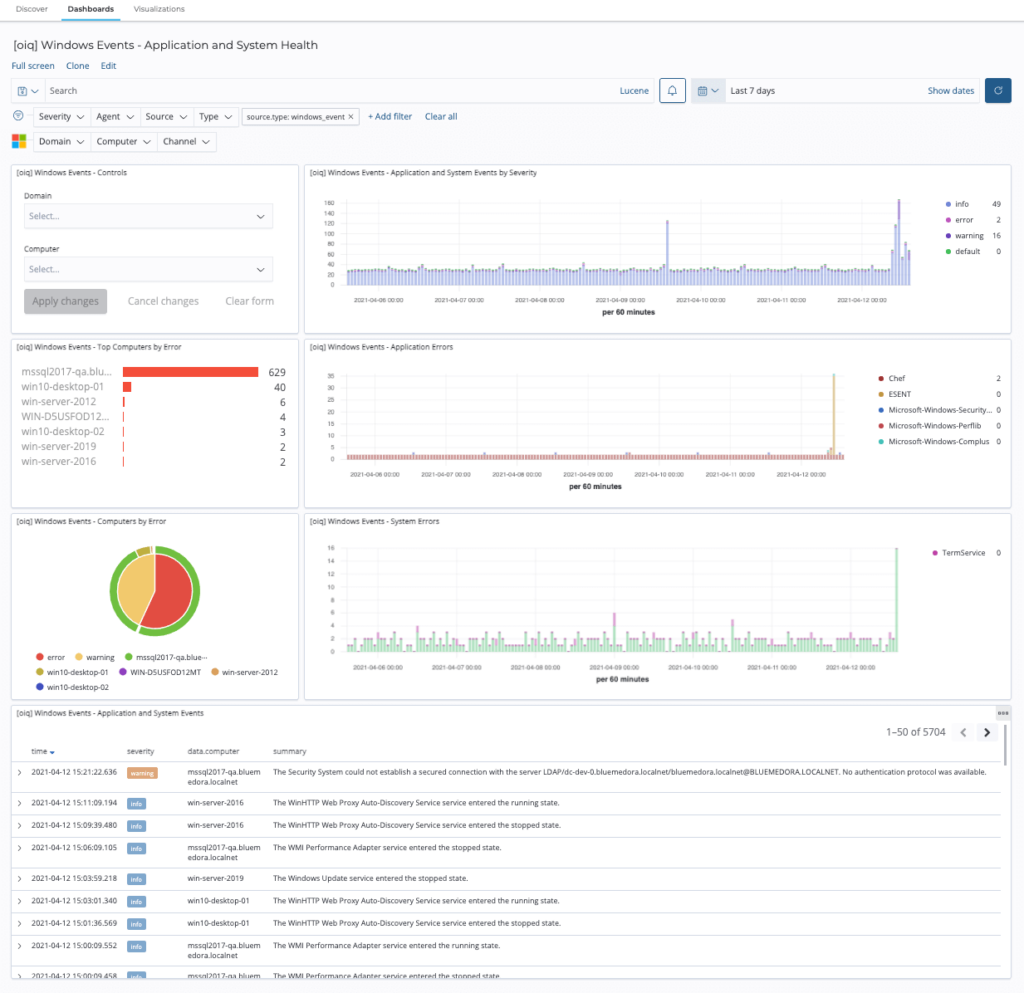
Application and System Health Dashboard
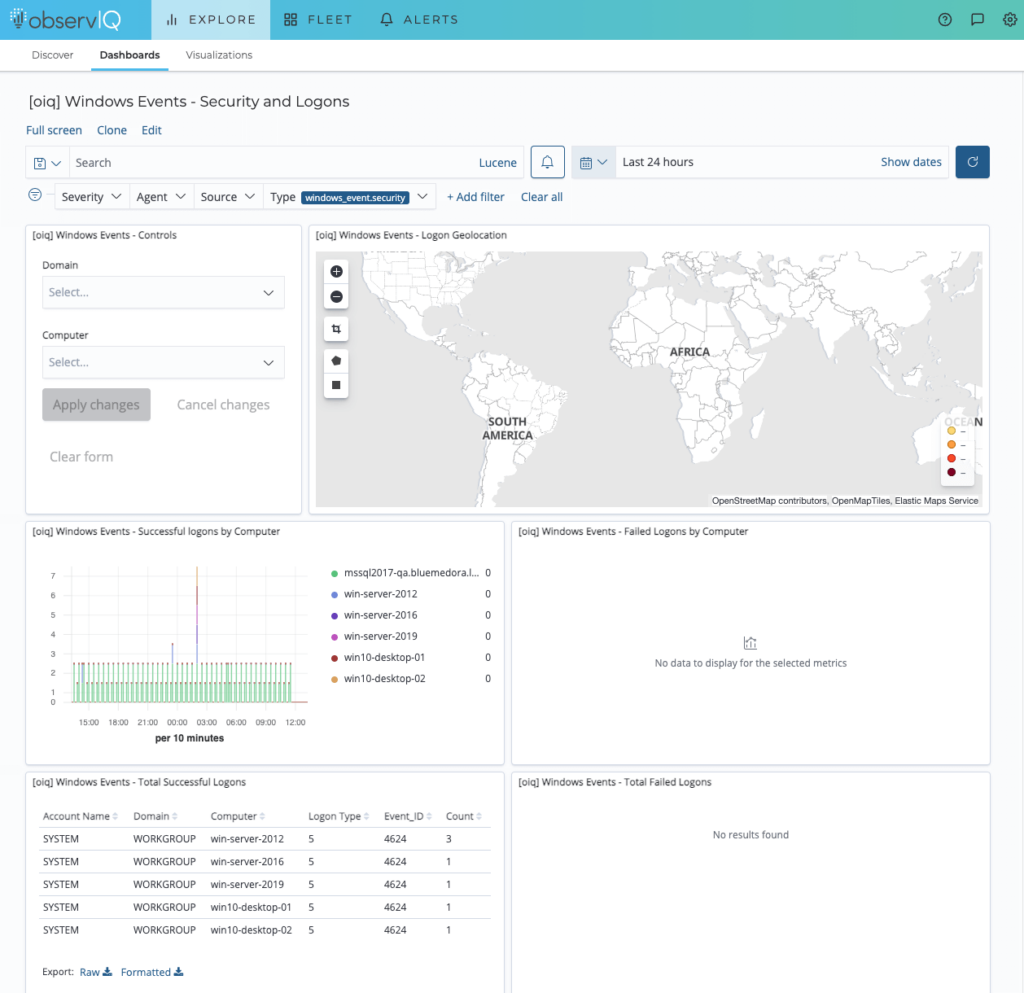
Security and Logins Dashboard
Wrapping Up
And there you have it: Windows events in 5 minutes – it’s really that simple with observIQ. With guided configuration, support for popular Sources like Windows Event Log, and automatically installed dashboards, you can quickly start analyzing your events in minutes instead of hours or days.
Check out our integrations page for more information about the other Windows integrations observIQ supports.