How to Install and Configure an OpenTelemetry Collector
In the last 12 months, there’s been significant progress in the OpenTelemetry project -- arriving in the form of contributions, stability, and adoption. As such, it felt like a good time to refresh this post, providing project newcomers with a short guide to get up and running quickly.
In this post, I'll step through:
- A brief overview of OpenTelemetry and the OpenTelemetry Collector
- A simple guide to install, configure, and ship observability data to a back-end using the OpenTelemetry Collector
OpenTelemetry: A Brief Overview
What is OpenTelemetry?
The OpenTelemetry project (“OTel”), incubated by the CNCF, is an open-source framework that standardizes the way observability data (metrics, logs, and traces) are gathered, processed, and exported. OTel squarely focuses on observability data, and unlocks a vendor-agnostic pathway to nearly any back-end for insight and analysis.
What is an OpenTelemetry Collector?
The OpenTelemetry collector is a service responsible for ingesting, processing, and transmitting observability data. Data is shared between data sources, components, and back-ends with a standardized protocol known as the OpenTelemetry Protocol (“OTLP”). The collector can be installed locally as a traditional agent, deployed remotely as a collector, or as an aggregator, ingesting data from multiple collectors.
Related Content: OpenTelemetry in Production: A Primer
observIQ's contributions to OpenTelemetry
In 2021, observIQ donated Stanza to the project, which became the primary logging component of the collector (moved to 'stable' status in 2023). Our team continues to contribute to the project on a daily basis. Most recently, our team has made significant contributions to OpAMP, and Connectors.
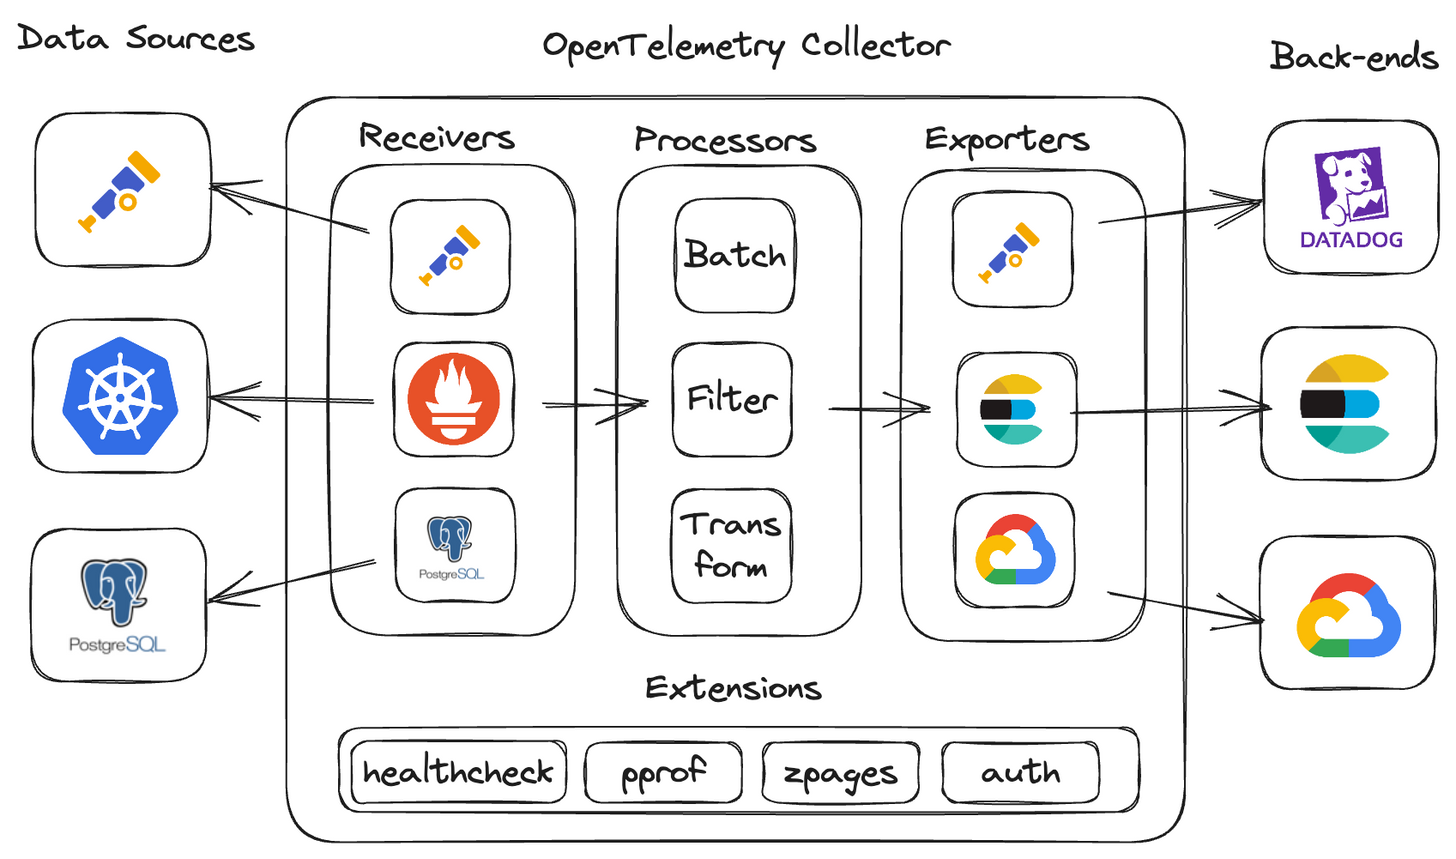
What are the primary components of the OpenTelemetry collector?
- Receivers: ingest data into the collector
- Processor: enrich, reduce, and refine the data
- Exporters: export the data to another collector or back-end
- Connectors: connect two or more pipelines together
- Extensions: expand collector functionality, in areas not directly related to data collection, processing, or transmission.
These components can be linked together to create a logical, human-readable observability data pipeline within the collector’s configuration.
Starting small: collecting and exporting host metrics and logs
A simple, but ever-critical use case is observing the health and performance of a linux host running any workload. This is achieved by collecting and shipping host metrics and logs to a back-end for visualization and analysis. So, let’s start there.
What you’ll need
- A linux host with super user privileges - any modern distribution will work. I’ve deployed a Debian 10 VM on GCE for this example.
- A back-end - I’ve chosen Grafana Cloud, as it offers a free tier that provides a native OTLP endpoint for ingesting data, streamlining the configuration a bit.
- A Grafana Cloud <access policy token, <instance_ID>, and <region>. You can follow the link to get set up (takes about 5 minutes): https://grafana.com/docs/grafana-cloud/monitor-infrastructure/otlp/send-data-otlp/
Installing the collector
First, run the installation command on your host:
1sudo apt-get update
2sudo apt-get -y install wget systemctl
3wget https://github.com/open-telemetry/opentelemetry-collector-releases/releases/download/v0.85.0/otelcol-contrib_0.85.0_linux_amd64.deb sudo dpkg -i otelcol-contrib_0.85.0_linux_amd64.debNote: you can replace ‘0.85.0’ with newer releases as they become available.
Once complete, otelcol-contrib will be added and managed by systemd; the collector will start automatically.
You’ll find collector configuration file here:
/etc/otelcol-contrib/config.yaml
Related Content: How to Install and Configure an OpenTelemetry Collector
Reviewing the default configuration
[Optional] If you’re already familiar with the default config, you can move on to the Configuring the Collector section below.
The default config.yamll includes pre-configured (also optional) components and a sample pipeline to better understand the syntax. Let’s quickly take a look at each section:
cat /etc/otelcol-contrib/config.yaml
Extensions
1extensions:
2  health_check:
3  pprof:
4    endpoint: 0.0.0.0:1777
5  zpages:
6 endpoint: 0.0.0.0:55679- health_check: exposes an HTTP endpoint with the collector status information
- pprof: exposes net/HTTP/pprof endpoint to investigate and profile the collector process
- zpages: exposes an HTTP endpoint for debugging the collector components
Receivers
1receivers:
2  otlp:
3    protocols:
4      grpc:
5      http:
6  opencensus:
7  prometheus:
8    config:
9      scrape_configs:
10      - job_name: 'otel-collector'
11        scrape_interval: 10s
12        static_configs:
13        - targets: ['0.0.0.0:8888']
14  jaeger:
15    protocols:
16      grpc:
17      thrift_binary:
18      thrift_compact:
19      thrift_http:
20 zipkin:- otlp: ingests OTLP formatted data from an app/system or another OTel collector
- opencensus: ingests spans from OpenCensus instrumented applications.
- prometheus: ingests metrics in Prometheus format -- pre-configured to scrape the collector’s Prometheus endpoint
- zipkin: ingests trace data in Zipkin format
- jaeger: ingests trace data in Jaeger format
Processors
1processors:
2 batch:- batch: transmits telemetry data in batches, instead of streaming each data point or event.
Exporters
1exporters:
2  logging:
3 verbosity: detailed- logging: exports collector data to the console. Very useful for quickly determining your config is working
Service
1service:
2  pipelines:
3    traces:
4      receivers: [otlp,opencensus,jaeger,zipkin]
5      processors: [batch]
6      exporters: [logging]
7    metrics:
8      receivers: [otlp,opencensus,prometheus]
9      processors: [batch]
10      exporters: [logging]
11 extensions: [health_check,pprof,zpages]- service: (AKA, “the collector”) where pipelines are assembled. It’s important to know that a component won’t be enabled unless it’s been referenced here.
- pipelines: reference the receivers, processors, and exporters configured above. Some (but not all) components can be shared across pipelines, as seen in the example (otlp, batch, logging).
- extensions: here’s where you enable your extensions that you’ve configured above.
- Note: logging, is the third type of pipeline you can create, but has not been added to the default config
Configuring the collector
Next, let's update the config:
vim /etc/otelcol-contrib/config.yaml
Here's the high-level steps I followed:
- removed optional components (for clarity, totally optional)
- configured the required components
- constructed both a metrics and logs pipeline
Here's the result (with comments):
1extensions:
2  basicauth: # required to authenticate to the Grafana Cloud OTLP endpoint.
3    client_auth:
4      username: <Grafana Cloud Instance ID>
5      password: <Grafana Cloud Access Policy Token>
6
7receivers:
8  hostmetrics: # collects host metrics from the specified categories
9    collection_interval: 1m
10    scrapers:
11      cpu:
12      disk:
13      memory:
14      network:
15  filelog: # reads log file at the specified path, starting the end of the file
16    start_at: end
17    include: [/var/log/syslog]
18
19processors:
20  batch:
21  resourcedetection: # detects and adds the hostname as resource metadata
22    detectors: ["system"]
23    system:
24      hostname_sources: ["os"]
25
26exporters:
27  otlphttp: # exports data in OTLP format
28    endpoint: https://otlp-gateway-prod-us-central-0.grafana.net/otlp
29    auth:
30      authenticator: basicauth
31
32service:
33  extensions: # reference outside of the pipeline
34    - basicauth
35  pipelines:
36    Metrics: # collects host metrics, batches payload,
37      receivers: [hostmetrics]
38      processors: [batch,resourcedetection]
39      exporters: [otlphttp,logging]
40    Logs: #
41      receivers: [filelog]
42      processors: [batch,resourcedetection]
43 exporters: [otlphttp,logging]Once the config.yaml has been updated, restart the collector review the output in your console:
1systemctl restart otelcol-contrib && journalctl -f --unit otelcol-contribIf all is well, you’ll start to see activity like this in your console, indicating the collector has restarted and data is flowing successfully:
Finding your observability data in Grafana Cloud
Lastly, access your Grafana Cloud account, launch Grafana, and head over to the Explore console. Grafana Cloud automatically maps and routes OTLP data to Prometheus, Loki, and Jaeger data sources (metrics, logs, and traces). Note: if you’re running a local instance of Grafana, use the Loki and Prometheus exporters in place of the otlp_http exporter.
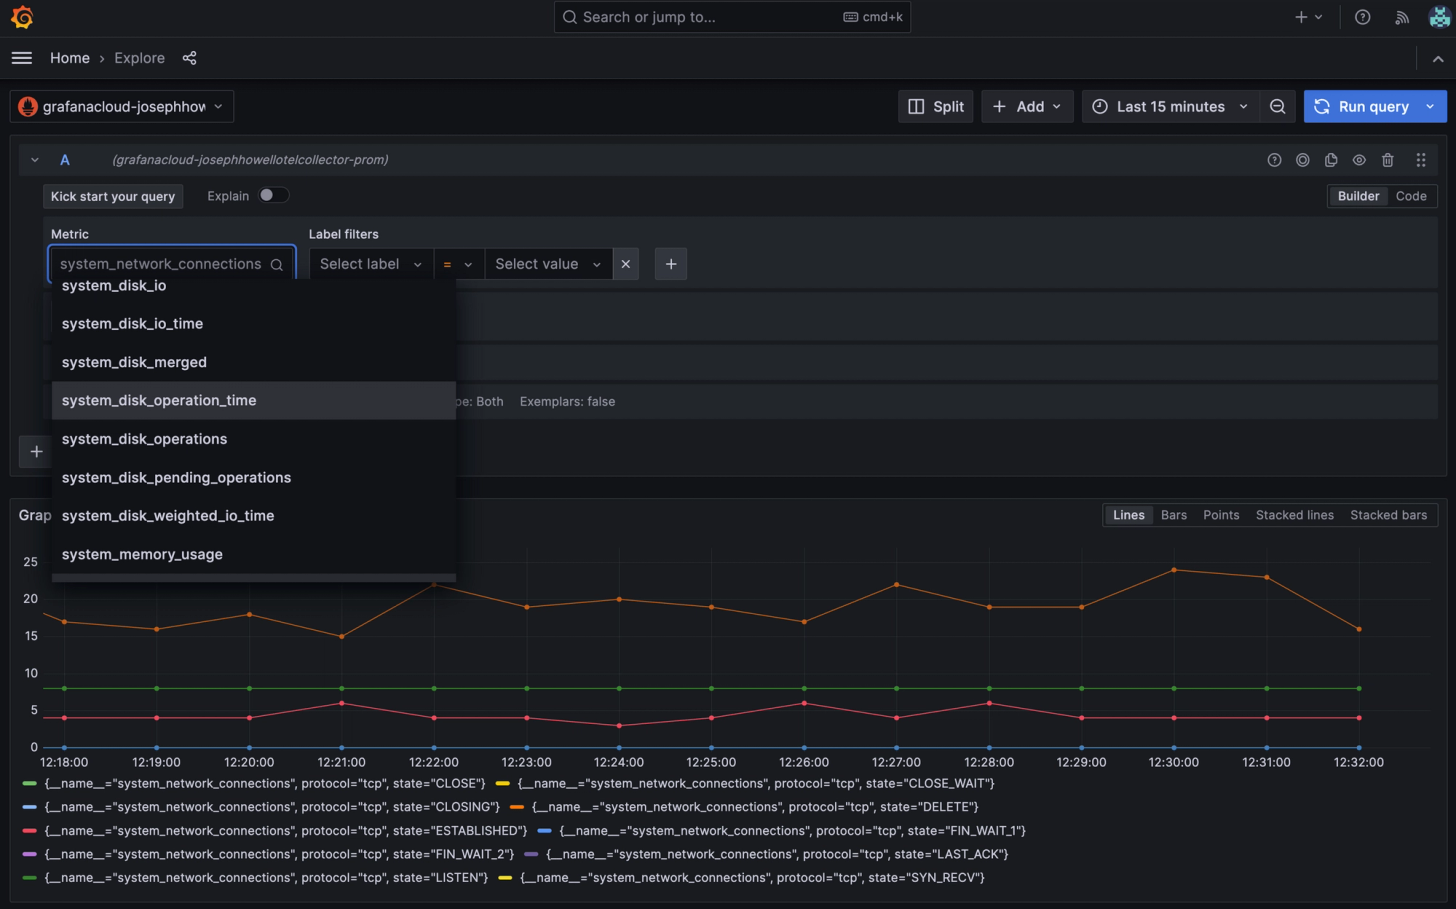
Finding your metrics
To view your metrics, select the Prometheus data source associated with your OTLP access policy. You’ll find the metric names associated with the groups we specified in the config.
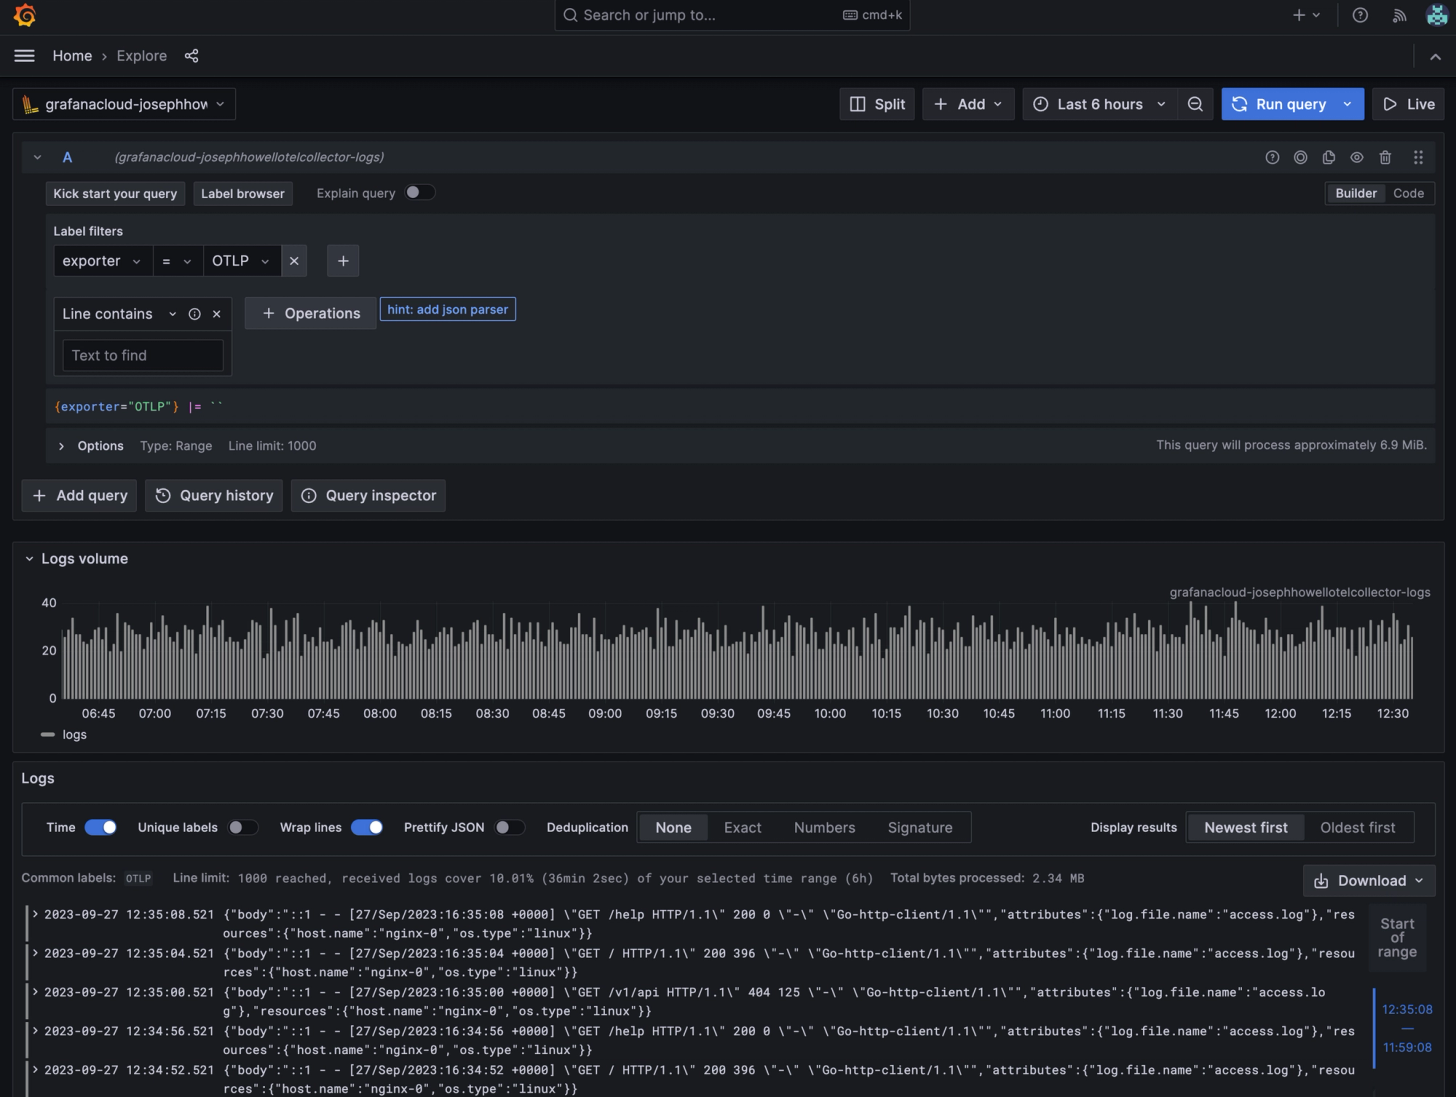
Finding your Logs
To view your logs, select the Loki data source associated with your OTLP access policy. Then select then set ‘exporter = OTLP’ as the label filter.
You’ve now successfully installed, configured, and shipped observability to a back-end using the OpenTelemetry collector. From here, you can continue to customize your configuration, build dashboards, and create alerts. I'll do a deep dive into those topics in a future post.
If you have questions, feedback, or want to chat about OpenTelemetry, observability, feel free to reach out on the CNCF slack, or email me at joseph.howell@observiq.com.