How to Monitor Host Metrics with OpenTelemetry

In this post, I'll walk you through installing and configuring the OpenTelemetry Collector and gathering and shipping host metrics to Google Cloud Operations from a Windows and Linux host.
Pre-reqs:
- A Linux or Windows host running on GCE. I'm using Debian and a Windows Server 2022 image in this example.
Step 1: Install the collector
On Linux:
Download and install the package:
1sudo apt-get update
2sudo apt-get -y install wget systemctl
3wget https://github.com/open-telemetry/opentelemetry-collector-releases/releases/download/v0.85.0/otelcol-contrib_0.85.0_linux_amd64.deb sudo dpkg -i otelcol-contrib_0.85.0_linux_amd64.debOnce complete, otelcol-contrib will be added and managed by config.yaml; the collector will start automatically.
You’ll find the collector configuration file here:/etc/otelcol-contrib/config.yaml
On Windows:
On your Windows host, you can download the latest Windows executable from the open telemetry-collector-releases repo on your host.
Once downloaded, open the command prompt as an Administrator, and untar the executable using the following command:
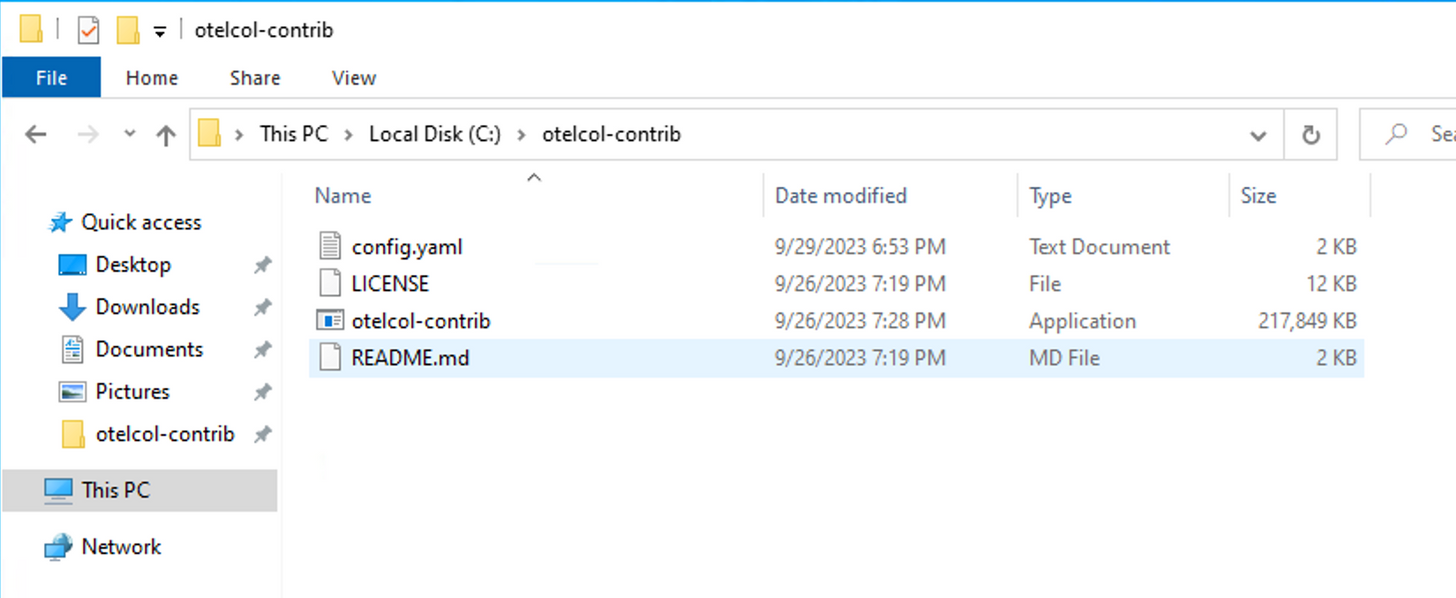
1tar -xvzf C:\PATH\TO\FILE\otelcol-contrib_0.86.0_windows_amd64.tar.gz -C C:\PATH\TO\FOLDER\EXTRACTIONAfter extracting the executable, download or copy the config.yaml to the collector's root directory:
For reference, here's the default config:
1# To limit exposure to denial of service attacks, change the host in endpoints below from 0.0.0.0 to a specific network interface.
2# See https://github.com/open-telemetry/opentelemetry-collector/blob/main/docs/security-best-practices.md#safeguards-against-denial-of-service-attacks
3
4extensions:
5  health_check:
6  pprof:
7    endpoint: 0.0.0.0:1777
8  zpages:
9    endpoint: 0.0.0.0:55679
10
11receivers:
12  otlp:
13    protocols:
14      grpc:
15        endpoint: 0.0.0.0:4317
16      http:
17        endpoint: 0.0.0.0:4318
18
19  opencensus:
20    endpoint: 0.0.0.0:55678
21
22  # Collect own metrics
23  prometheus:
24    config:
25      scrape_configs:
26      - job_name: 'otel-collector'
27        scrape_interval: 10s
28        static_configs:
29        - targets: ['0.0.0.0:8888']
30
31  jaeger:
32    protocols:
33      grpc:
34        endpoint: 0.0.0.0:14250
35      thrift_binary:
36        endpoint: 0.0.0.0:6832
37      thrift_compact:
38        endpoint: 0.0.0.0:6831
39      thrift_http:
40        endpoint: 0.0.0.0:14268
41
42  zipkin:
43    endpoint: 0.0.0.0:9411
44
45processors:
46  batch:
47
48exporters:
49  logging:
50    verbosity: detailed
51
52service:
53
54  pipelines:
55
56    traces:
57      receivers: [otlp, opencensus, jaeger, zipkin]
58      processors: [batch]
59      exporters: [logging]
60
61    metrics:
62      receivers: [otlp, opencensus, prometheus]
63      processors: [batch]
64      exporters: [logging]
65
66 extensions: [health_check, pprof, zpages]Related Content: Rapid telemetry for Windows with OpenTelemetry and BindPlane OP
Step 2: Configure the collector
Next, update the config.yaml with the one I’ve provided below. We've updated the config to use the collector components below. Both Windows and Linux can use the same config:
- hostmetrics receiver
- resourcedetection processor
- googlecloud exporter
1# To limit exposure to denial of service attacks, change the host in endpoints below from 0.0.0.0 to a specific network interface.
2# See https://github.com/open-telemetry/opentelemetry-collector/blob/main/docs/security-best-practices.md#safeguards-against-denial-of-service-attacks
3
4extensions:
5  health_check:
6  pprof:
7    endpoint: 0.0.0.0:1777
8  zpages:
9    endpoint: 0.0.0.0:55679
10
11receivers:
12  otlp:
13    protocols:
14      grpc:
15        endpoint: 0.0.0.0:4317
16      http:
17        endpoint: 0.0.0.0:4318
18
19  opencensus:
20    endpoint: 0.0.0.0:55678
21
22  hostmetrics:
23  collection_interval: 60s
24  scrapers:
25    cpu:
26    disk:
27    load:
28    filesystem:
29    memory:
30    network:
31    paging:
32    processes:
33
34  # Collect own metrics
35  prometheus:
36    config:
37      scrape_configs:
38      - job_name: 'otel-collector'
39        scrape_interval: 10s
40        static_configs:
41        - targets: ['0.0.0.0:8888']
42
43  jaeger:
44    protocols:
45      grpc:
46        endpoint: 0.0.0.0:14250
47      thrift_binary:
48        endpoint: 0.0.0.0:6832
49      thrift_compact:
50        endpoint: 0.0.0.0:6831
51      thrift_http:
52        endpoint: 0.0.0.0:14268
53
54  zipkin:
55    endpoint: 0.0.0.0:9411
56
57processors:
58  batch:
59  resourcedetection:
60  detectors: ["system"]
61  system:
62    hostname_sources: ["os"]
63
64exporters:
65  logging:
66    verbosity: detailed
67
68  exporters:
69    googlecloud:
70
71
72service:
73
74  pipelines:
75
76    metrics:
77      receivers: [otlp, opencensus, jaeger, zipkin, hostmetrics]
78      processors: [batch,resourcedetection]
79      exporters: [googlecloud]
80
81 extensions: [health_check, pprof, zpages]Then restart the collector:
On Linux:
1systemctl restart observiq-otel-collectorOn Windows:
1C:\otelcol-contrib\otelcol-contrib.exe -C C:\otelcol-contrib\config.yamlRelated Content: How to Install and Configure an OpenTelemetry Collector
Step 3: viewing the metrics in Google Cloud Operations
You should now be able to view the host metrics in the Metrics Explorer in Google Cloud.
Metrics collected
Conclusion
And that’s it - up and running with OpenTelemetry, shipping host metrics from a Windows and Linux VM in Google could. If you have questions or feedback or want to chat about OpenTelemetry or observability, please reach out on the CNCF Slack or email me at joseph.howell@observiq.com.