How to Monitor Microsoft IIS with OpenTelemetry
The OpenTelemetry members at observIQ are excited to add Microsoft IIS metric monitoring support to OpenTelemetry! You can now easily monitor your IIS web servers with the oIQ OpenTelemetry Collector.
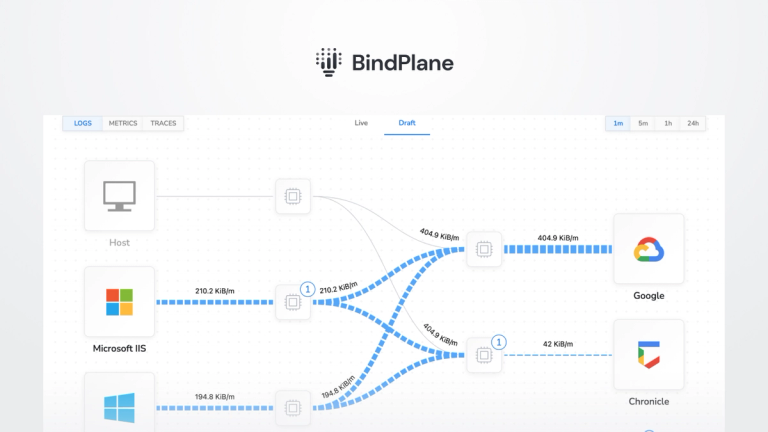
You can add the IIS metric receiver to any OpenTelemetry collector. This post demonstrates just one configuration for shipping metrics with OpenTelemetry components. This configuration and many other observIQ OpenTelemetry configurations are available in the oIQ Opentelemetry Collector.
Installation and configuration are simple, but you can refine your configuration once the metric receiver is up and running. The configuration is easily editable as a yaml file. You can find more documentation, example configurations for other receivers, and observability tools on GitHub and our blog.
What Matters for Microsoft IIS Metrics
Microsoft IIS is a general-purpose platform for web servers and applications. The possible scale and scope of IIS monitoring are vast, so the specific metrics that matter most to you might vary. Uptime, data flow, and request metrics are the most commonly monitored.
Step 1: Installing the Collector
The oIQ OpenTelemetry Collector can be installed on Windows, MacOS, and Linux using single-line install commands that can be copied directly from GitHub. Be sure that you have administrator privileges on the device or VM you are running the installation on. Since Microsoft IIS is a Windows-based product, only the Windows installation steps are shown below.
1msiexec /i "https://github.com/observIQ/observiq-otel-collector/releases/latest/download/observiq-otel-collector.msi" /quietRelated Content: How to Install and Configure an OpenTelemetry Collector
Step 2: Prerequisites and Authentication Credentials
In the following example, we use Google Cloud Operations as the destination. However, OpenTelemtry offers exporters for many destinations. Check out the list of exporters here.
Setting up Google Cloud exporter prerequisites:
If running outside of Google Cloud (On-prem, AWS, etc.) or without the Cloud Monitoring scope, the Google Exporter requires a service account.
Create a service account with the following roles:
- Metrics: roles/monitoring.metricWriter
- Logs: roles/logging.logWriter
Create a service account JSON key and place it in the system running the collector.
Windows
In this example, the key is placed at C:/observiq/collector/sa.json.
Set the GOOGLE_APPLICATION_CREDENTIALS with the command prompt setx command.
Run the following command.
1setx GOOGLE_APPLICATION_CREDENTIALS "C:/observiq/collector/sa.json" /mRestart the service using the services application.
Related Content: Rapid telemetry for Windows with OpenTelemetry and BindPlane OP
Step 3: Configure the Microsoft IIS Receiver
After installation, the config file for the collector can be found at:
Windows: C:\Program Files\observIQ OpenTelemetry Collector\config.yaml
MacOS/Linux: /opt/observiq-otel-collector/config.yaml
Edit the config file with the following configuration:
1receivers:
2  iis:
3    collection_interval: 60s
4
5processors:
6  # Resourcedetection is used to add a unique (host.name)
7  # to the metric resource(s), allowing users to filter
8  # between multiple agent systems.
9  resourcedetection:
10    detectors: ["system"]
11    system:
12      hostname_sources: ["os"]
13
14  # Used for Google generic_node mapping.
15  resource:
16    attributes:
17    - key: namespace
18      value: "iis"
19      action: upsert
20    - key: location
21      value: "global"
22      action: upsert
23
24  normalizesums:
25
26  batch:
27
28exporters:
29  googlecloud:
30    retry_on_failure:
31      enabled: false
32    metric:
33      prefix: workload.googleapis.com
34    resource_mappings:
35    - source_type: ""
36      target_type: generic_node
37      label_mappings:
38      - source_key: host.name
39        target_key: node_id
40      - source_key: location
41        target_key: location
42      - source_key: namespace
43        target_key: namespace
44
45service:
46  pipelines:
47    metrics:
48      receivers:
49      - iis
50      processors:
51      - resourcedetection
52      - resource
53      - normalizesums
54      - batch
55      exporters:
56 - googlecloudThe configuration is set to receive metrics from the Microsoft IIS server to Google Cloud. You can specify your destination and insert any necessary credentials near the top of the “receivers” section of the config file.
The following notes apply to Google Cloud:
- The interval for fetching metrics is 60 seconds by default.
- In the Google Cloud exporter, do the following mapping:
- Set the target type to a generic node to simplify filtering metrics from the collector in cloud monitoring.
- Set node_id, location, and namespace for the metrics. The resource processor sets the location and namespace.
- The project ID is not set in the configuration. Google automatically detects the project ID.
- Add the normalizesums processor to exclude the first metric with a zero value when the configuration is done and the collector is restarted.
- Add the batch processor to bundle the metrics from multiple receivers. We highly recommend using this processor in the configuration, especially for the benefit of the collector's logging component.
Step 4: View Your Metrics
Below is a table of the metrics that OpenTelemetry collects on Microsoft IIS. You can exclude metrics by adding the following line to your config file with the metric name you want to exclude:
1metrics:
2  <metric_name>:
3 enabled: <true|false>observIQ’s distribution is a game-changer for companies looking to implement the OpenTelemetry standards. The single-line installer, seamlessly integrated receivers, exporter, and processor pool make working with this collector simple. Follow this space to keep up with all our future posts and simplified configurations for various sources. For questions, requests, and suggestions, contact our support team at support@observIQ.com.