Logging, Monitoring, and Debugging in Kubernetes

Monitoring Directly in Kubernetes
No matter what you’re using Kubernetes for, visibility into your applications’ performance and activity is a beneficial and often essential undertaking – essential but colossal, requiring entire teams dedicated to nothing but maintaining deployments, auditing, debugging, and keeping up with compliance. Kubernetes has robust support documentation exclusively devoted to assisting customers with Monitoring, Logging, and Debugging. Kubernetes is a powerful resource, and its monitoring, logging, auditing, and debugging instructions are detailed enough for almost anyone, even a tube newbie, to get the job done. Their documentation also illustrates the inescapable overhead of handling these needs directly in Kubernetes. For many developers, there isn’t time.
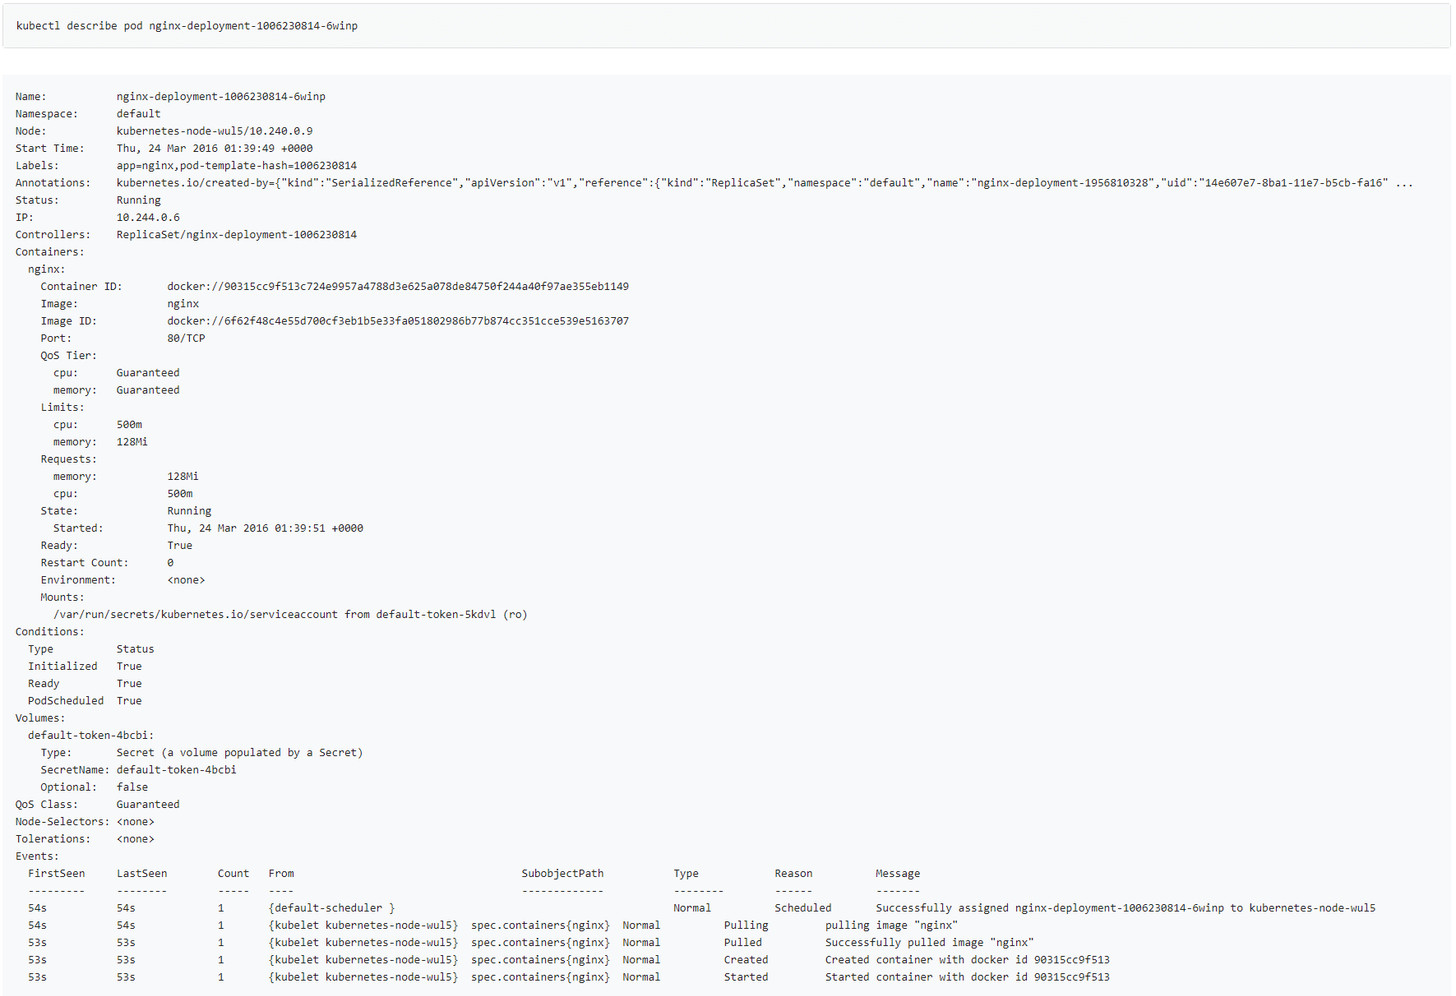
There are seven lengthy sections on logging and using logs to debug issues in Kubernetes. The step-by-step instructions show you how to set up and monitor logs on various pods with specific audit criteria. The intention is to provide teams with the tools and knowledge to debug and maintain their applications directly in Kubernetes. Indeed, logs will often contain all the information necessary to hone in on and correct a bug, but skimming through text lines in search of valuable, actionable information is a headache. It’s a working solution but not a reasonable one for small teams that need to move fast.
Meeting Observability Needs
In most cases, from solo contractors to massive enterprise deployments, a log management system is a better solution. observIQ supports over 60 logging agents with copy-paste installations on Kubernetes. You can version control your agents alongside your applications with Git, so maintaining, updating, or reverting doesn’t stop the flow of information. It makes collecting and accessing the information you need super easy. That’s enough to raise a lot of eyebrows, but what matters is what you can do with the data once you have it, and that is where log management platforms like observIQ thrive.
Building your tools, implementing open-source tools such as OpenTelemetry, or committing to the cost and overhead of an enterprise log management system to analyze and gain insights from your log data all present massive challenges and trade-offs. The objective is to spend less time and fewer resources solving issues than the issue costs in the first place. observIQ is built to give developers insight into their applications and bring them the information they need to solve problems without breaking the bank. In many cases, it’s even free.
The observIQ Solution
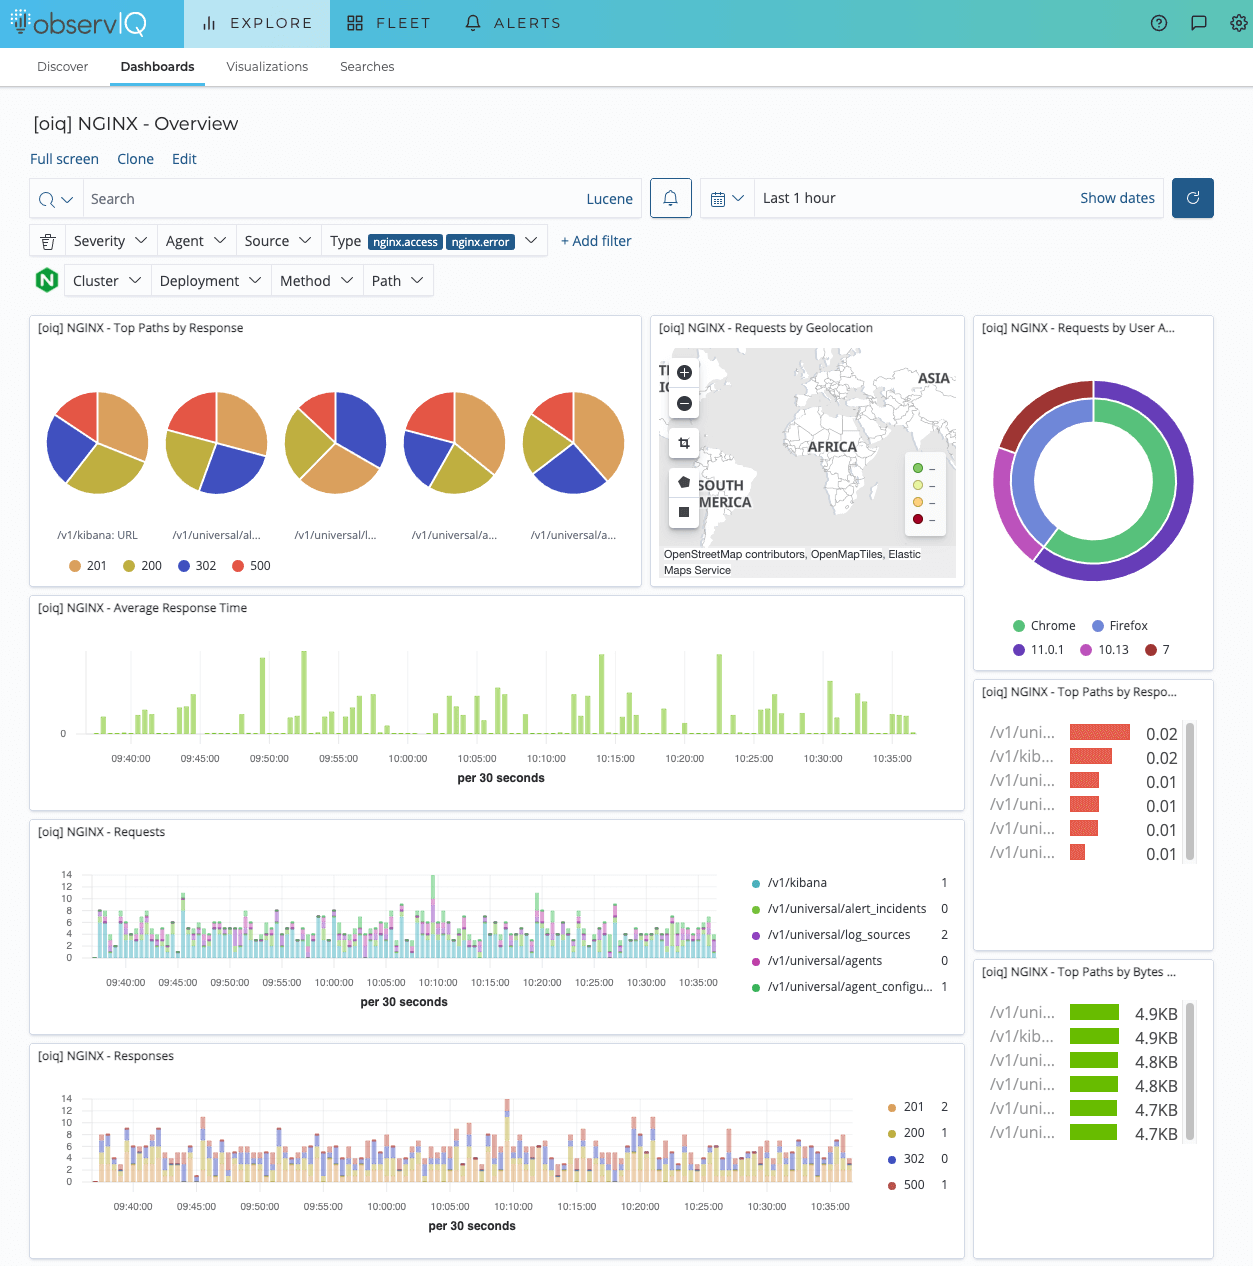
Free log management is way trickier with open-source tools. It often involves implementing and tweaking multiple tools to fit your specific needs and then managing an analytics tool that can handle your data in a valuable way. ObservIQ is built precisely to address the pains that sometimes cause developers to abandon observability altogether. We give you dashboards full of insightful analytics tools that can be easily adjusted to target your needs. Logs from your deployments, applications, and pods are ingested in one place and organized to generate insight. Compliance needs are fully automated, alerts keep you apprised of any issues that need immediate attention in real-time, and your team gets unlimited accounts on a single plan. It’s the best way to create peace of mind and set the stage to focus on what matters.