Tracing Services Using OTel and Jaeger
At observIQ, we use the OTel collector to collect host/container-level metrics and logs from our systems. However, to monitor our applications (APM) in more detail, we use the OTel SDK and instrumentation libraries. This post aims to provide a quick start to setting up tracing exporting to a local Jaeger instance.
What are traces?
A trace is a collection of spans, which represent the execution of a logical unit of work. For example, this could be an HTTP request to an API which requires the server to verify the request is authenticated and fetch data from a database; the trace could consist of two traces: verifying authentication and, if successful, querying the database.
1-------------------------------------------------------------
2|                         Trace ABCDE                         |
3 -------------------------------------------------------------
4 --------------------   --------------------------------------
5|  Verify auth (5ms) | |        Fetch Data (120ms)            |
6 ____________________   ______________________________________
7 Span1 Span2Each span can have labels/attributes added to it to provide more detail, for example, the ID of a record being requested or the number of events about to be dispatched. Because spans are organized inside a trace, attributes don’t need to be added to each one. A common pattern is creating a trace for each API request and a span for each method that relies on an external system or time-intensive computation.
For more detailed explanations, I recommend reviewing OpenTelemetry’s documentation.
How to configure Jaeger
We’ll configure Jaeger to run locally as a container for simplicity's sake.
1podman run -d --name jaeger \
2        -e COLLECTOR_ZIPKIN_HOST_PORT=:9411 \
3        -e COLLECTOR_OTLP_ENABLED=true \
4        -p 6831:6831/udp \
5        -p 6832:6832/udp \
6        -p 5778:5778 \
7        -p 16686:16686 \
8        -p 4319:4317 \
9        -p 4320:4318 \
10        -p 14250:14250 \
11        -p 14268:14268 \
12        -p 14269:14269 \
13        -p 9411:9411 \
14 jaegertracing/all-in-one:1.42Jaeger is now available through its web UI at localhost:16686, and we’ll export traces over the port 14250.
How to configure exporter
The first requirement is to set the TracerProvider using the SetTracerProvider method from OTel. For exporting to Jaeger, we’ll actually configure an OTLP exporter pointing to our collector running an OTLP receiver. This allows us to perform filtering in the collector and supports exporting to other destinations like Google Cloud Tracing or Zipkin without changing any code. The exact method for creating the exporter is in the NewOTLPExporter method, but this is a simpler version for exporting to the collector locally on port 4317:
1func initTraceProvider(ctx context.Context) (*trace.TracerProvider, error) {
2   hostname, _ := os.Hostname()
3   resources := resource.NewWithAttributes(
4      semconv.SchemaURL,
5      semconv.ServiceNameKey.String("ourservice"),
6      semconv.HostArchKey.String(runtime.GOARCH),
7      semconv.HostNameKey.String(hostname),
8   )
9   conn, err := grpc.DialContext(ctx, "localhost:4317", grpc.WithInsecure())
10   if err != nil {
11      return nil, err
12   }
13
14   exporter, err := otlptracegrpc.New(ctx, otlptracegrpc.WithInsecure(), otlptracegrpc.WithGRPCConn(conn))
15   if err != nil {
16      return nil, err
17   }
18
19   return trace.NewTracerProvider(
20      trace.WithBatcher(exporter),
21      trace.WithResource(resources),
22   ), nil
23}With TracerProvider set, any new traces created with otel.Tracer will automatically export to the collector.
Instrumenting
OTel provides some packages to automatically instrument popular HTTP libraries, such as gorilla/mux and gin-gonic/gin. Using these will create traces for each request, requiring no code changes. To add additional instrumentation, we need a Tracer instance. A simple pattern for this is to instantiate a named tracer at the package level and reuse it when needed.
As a simple example, imagine we have an HTTP API that looks up orders by ID from our Redis database. You can find the full code being referenced here at GitHub.
1ctx, span := tracer.Start(ctx, "getOrder")
2defer span.End()Start returns a new span, and a context containing the span. If the context already contained a span, this new span is created as the child of it. We ensure the span is marked as completed and collected by deferring the call to span.End(). We can set attributes on the span later, or when creating it.
1ctx, span := tracer.Start(ctx, "getOrder", trace.WithAttributes(attribute.String("orderID", id)))
2defer span.End()In addition to attributes, we can set the “status” of each span to indicate if an error happened. You could also set the status as successful, but to reduce lines of code we only explicitly set it for errors. RecordError differs from SetStatus in that it doesn’t modify the status of the span; it only records that an error occurred at the current time.
1order, err := rc.Get(ctx, id)
2if err != nil && !errors.Is(err, redis.Nil) {
3   span.RecordError(err)
4   span.SetStatus(codes.Error, err.Error())
5   c.AbortWithError(http.StatusInternalServerError, err)
6   return
7}Viewing traces
Once the server is running, we can make some queries to create traces.
1curl http://localhost:9911/v1/orders/23bI know the database has nothing with the key 23b, so I expect to see the trace reflect an error:
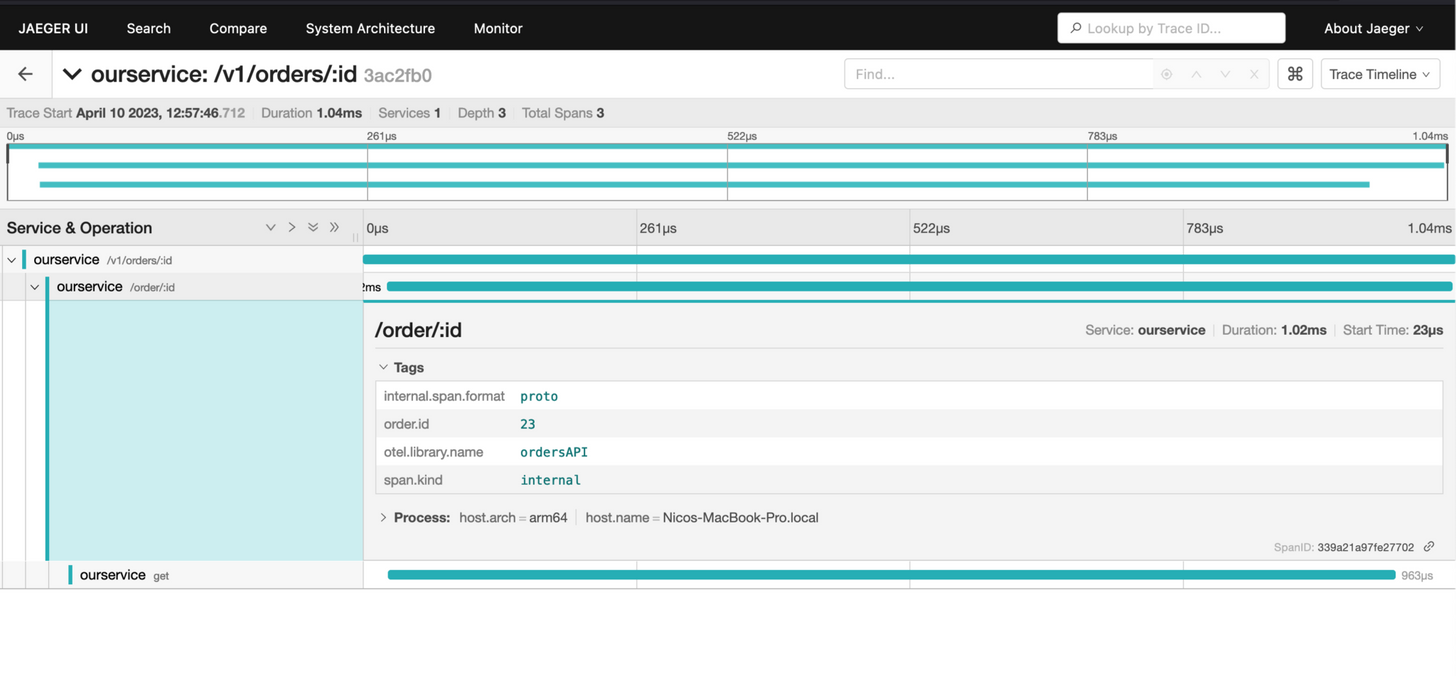
Alternately, querying for the order 23 should be successful.
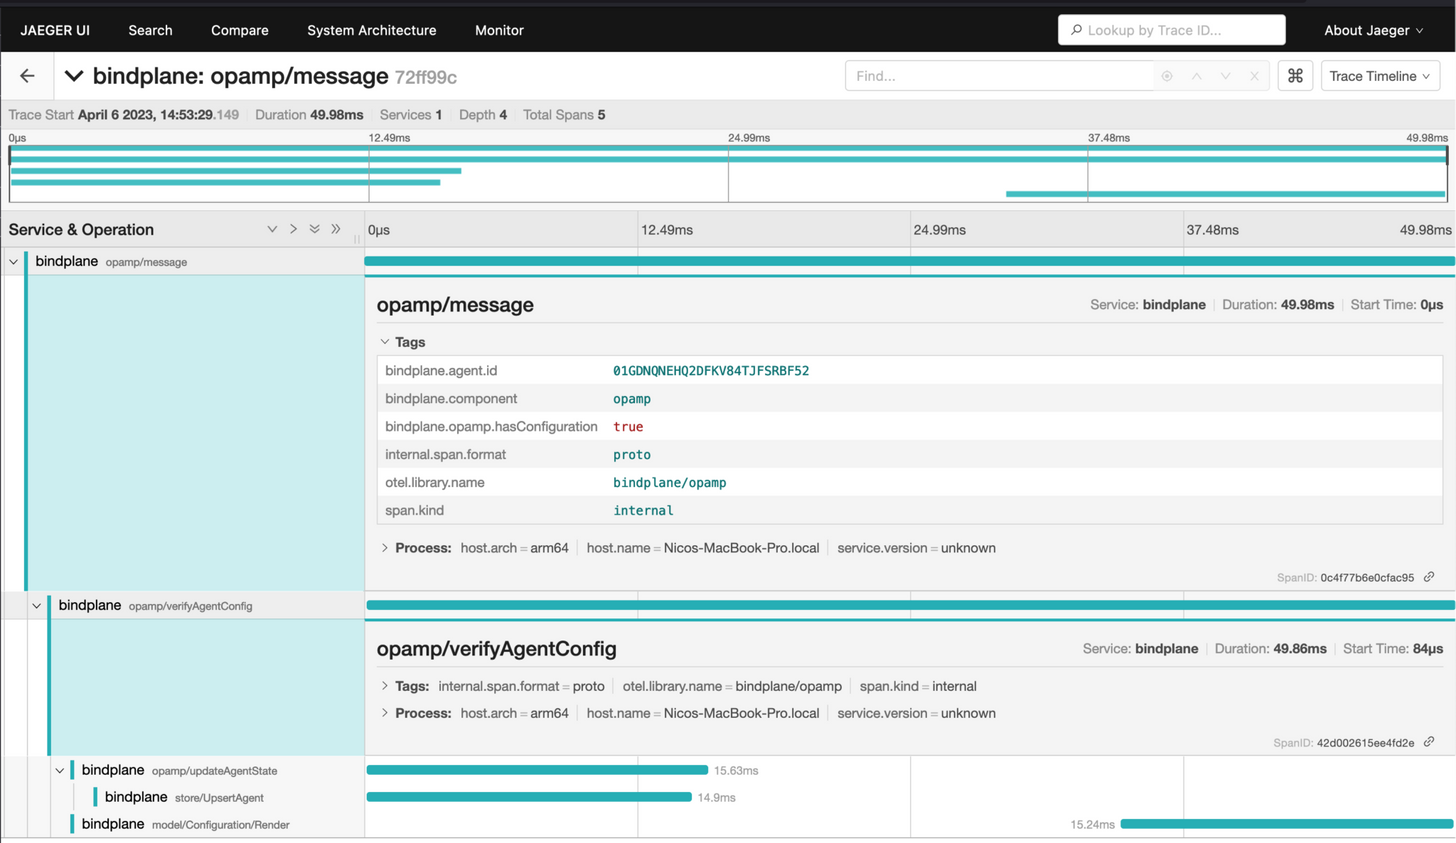
These are obviously very basic examples, below is a real trace from BindPlane OP which shows the steps taken to process a message from a collector:
Summary
Tracing can give deeper insight into applications than just logs or metrics on their own. By using the OTel libraries and exporting traces as OTLP, we can collect traces for multiple destinations using the same code.
Follow this space to keep up with all our future posts and simplified configurations for various sources. For questions, requests, and suggestions, reach out to our support team at support@observIQ.com or join our open-source community Slack Channel.