Troubleshooting Pod issues in Kubernetes with Live Tail
With the advent of IaaS (Infrastructure as a Service) and IaC (Infrastructure as Code), it is now possible to manage versioning, code reviews, and CI/CD pipelines at the infrastructure level through resource provisioning and on-demand service routing. Kubernetes is the indisputable choice for container orchestration. At this point, globally, most DevOps teams turn to Kubernetes to orchestrate and automate their software development processes, reducing the web server provisioning cost to the bare minimum.
Although Kubernetes offers an unparalleled solution to container orchestration, DevOps and development teams consider the observability practice for Kubernetes applications a constant challenge. Kubernetes as a platform is dynamic and expansive, with several components that are unique functionally and produce distinct outcomes behaviourally during implementation. As a result, teams formulate solutions on their own to their application logging challenges, even though Kubernetes offers a logging architecture OOTB. In addition, all Kubernetes applications produce a large volume of logs, making manual management a practical impossibility. The absence of a monitoring solution could bring about unfavorable network intrusions, as in the case of Tesla. In 2018, a very high-risk hack in Tesla’s network occurred from the Kubernetes admin console that was not password protected.
We wrote about simple logging techniques for Kubernetes applications. In this post, we look at how you can troubleshoot pod issues using the live tail feature in observIQ.
Kubernetes components to monitor:
- Clusters: A working Kubernetes cluster has two primary components: nodes and a control plane. The control plane maintains the Cluster in the desired state per the DevOps team’s configuration. The nodes manage the application workload.
- Pods: Every node in a working Kubernetes cluster has one or more pods. A group of containers that share the network’s resources, storage, namespace, etc., are called pods.
- Applications: A software application and its dependencies are packaged and containerized using Kubernetes as the container orchestration tool.
- Containers: A software application, its libraries, dependencies, and configurations are collectively called containers.
Related Content: Kubernetes Logging Simplified – Pt 1: Applications
Why Monitoring Pod Activity is Critical
Pods are the most straightforward deployable units of a containerized application. The one container per pod model is the most common use case for Kubernetes orchestrated applications. Pod statuses are transient; pod health equates to the application’s functioning. So, it is vital to constantly keep up with the pod’s activities, statuses, and events. Check Kubernetes’ documentation to know more about using pods.
Pod Statuses
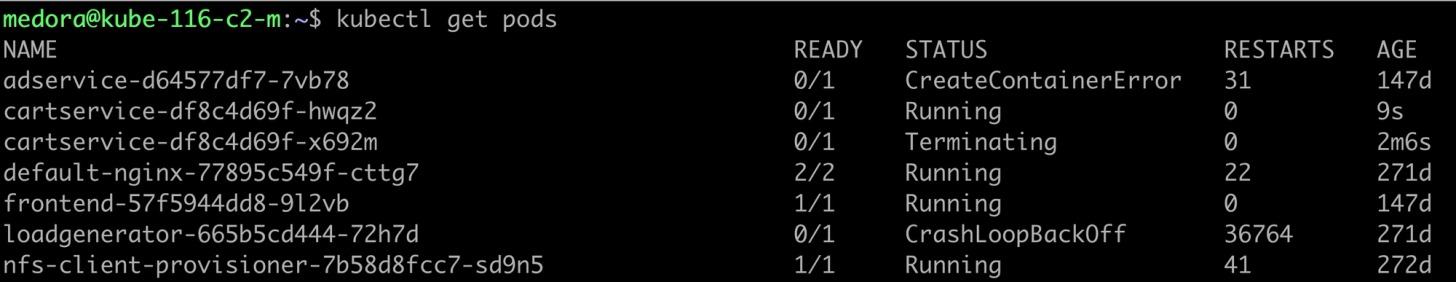
To get the statuses of all the pods in your cluster, use kubectl get pod.
- Running: When a pod is in the running status, it denotes that it is assigned to a node and has one or more containers operating as expected.
- Pending: A pod moves to the pending status if one or more of its containers are in the waiting status or if the pod cannot be scheduled. A container could move to the waiting status in the following scenarios:
- When the image defined for that container is unavailable, this may arise due to an error in spelling the name tag or an authentication failure.
- When there is a delay in downloading the container’s image due to its image size.
- When there is a readiness probe set for the container spec, the container will move to the ready status only if the conditions in the probe are met.
- When the pod fails to mount all the volumes specified in the spec, this could be due to a failed dynamic volume request or if the volume requested is already in use.
Use the kubectl describe pod command to check the change in container states as shown below:
- Succeeded: When all the containers in the pod are exited, they will not restart.
- Failed: A pod can be in the failed status for several reasons. Some of the most common causes for a pod failure are:
- When a container runs out of memory, the pod restarts the container according to the restart policy. However, if continuous restarts occur, the pod backs off the container from resuming. The way to check if this is the cause for pod failure is to run a check on the spec memory request and the limit set.
- When containers restart continuously, it is due to memory or CPU usage issues. An excellent way to check this is to run the kubectl exec -it command.
- When a pod terminates due to the removal from service of a node in which the pod exists, the cluster scheduler and the control manager do not clean out all the pods attached to the node.
- When a pod has insufficient bandwidth for resources from the node or inadequate persistent volume.
Related Content: observIQ Releases First PnP Solution for monitoring arm-based Kubernetes
Why a Log Management Tool is Necessary for Troubleshooting Kubernetes Pod Issues
Troubleshooting any application environment works best when you can live to tail the logs. To live tail pod events in Kubernetes, use the command kubectl logs -f to view logs flowing into the pod.
Related Content: Logging, Monitoring, and Debugging in Kubernetes
But when you’re tired of troubleshooting, having a tool that gives a 30-second agent installation option to collate your Kubernetes logs works better. The video below shows the logs from a specific pod in a Kubernetes application.
If you are impressed by what you see, try out observIQ for free today. The steps to install the observIQ agent and live tail logs are available in our documentation. We don’t restrict your trial with a credit card or endless setup processes. Sign up and get the logs flowing in minutes.