You Can Now Use observIQ Completely Free
Today, we’re excited to announce a new completely free pricing tier for observIQ: the 3-day free plan.
With the observIQ free plan, you can ingest and index up to 3 gigabytes of logs daily with a 3-day rolling retention period. The free plan also provides unrestricted access to the observIQ feature set – including guided one-line agent installation, fleet, and agent lifecycle management, built-in dashboards, vast Source/integration library, live tail, and alerts — all attached to an optimized and hosted Elastic stack. No standing up and managing your logging backend – no wasting time digging around in docs or configuration files or docs.
The free plan gives anyone access to a simple yet powerful hosted log management – all completely free.
What observIQ Features Are Available in the Free Plan?
All the features are pretty simple – no restrictions or functionality hidden behind a paywall. Here’s a quick rundown:
- Blazing-fast log agent powered by Stanza – outperforming other popular OSS agents like Fluentd, Fluent Bit, and Logstash
- Single-line agent installation commands for Linux, Mac, Windows, Kubernetes
- Over 40 pre-built Sources/integrations for popular technologies
- Fleet management: install and manage your Agents and Sources from the UI
- Automated log parsing and enrichment
- Built-in Dashboards
- Alerts – notifications for E-mail, Pagerduty, and Slack
- Live Tail – giving the ability to debug, live
- In-app chat with our support team to answer questions and listen to feedback.
Who can take advantage of the observIQ free plan?
Professionals: DevOps, ITOps, SRE, DevSecOps
Suppose you’re a professional managing a fleet of containerized applications, databases, or Windows machines. In that case, the free plan gives you the headroom and history to investigate and analyze incidents from various technologies and cloud-native applications. With simple yet powerful platform support for Kubernetes, Docker, Linux, Windows, and more – you can deploy a scalable logging solution in minutes and create threshold-based alerts to notify of critical incidents in your environment.
Additionally, installation commands are automation-friendly and compatible with popular frameworks like Ansible and Microsoft System Center Configuration Manager (SCCM).
Enthusiasts: Homelabbers, Gamers, Personal Users
If you’re building out a home lab or just looking to monitor your gaming desktop, mining rig, or Plex server, the observIQ Free plan is also a perfect fit for you. observIQ offers broad support for generic log sources like File, Journald, JSON, CSV, and Syslog – giving you the ability to monitor activity in any log you’re interested in. Home networking gear – appliances – firewalls like Ubiquiti Unifi and PFsense can commonly output to Syslog and can be easily ingested and parsed with observIQ’s Syslog integration with a few clicks. observIQ can also be used to monitor and map common security incidents, such as login activity in Windows.
How Do I Access The Free observIQ 3-day Plan?
To get started, sign up for a free trial for an observIQ here:
https://app.observiq.com/sign_up/
At any time during your trial, navigate to the billing page and choose the 3-Day Retention Plan. No credit card is required. Hit ‘apply’, and you’re good to go.
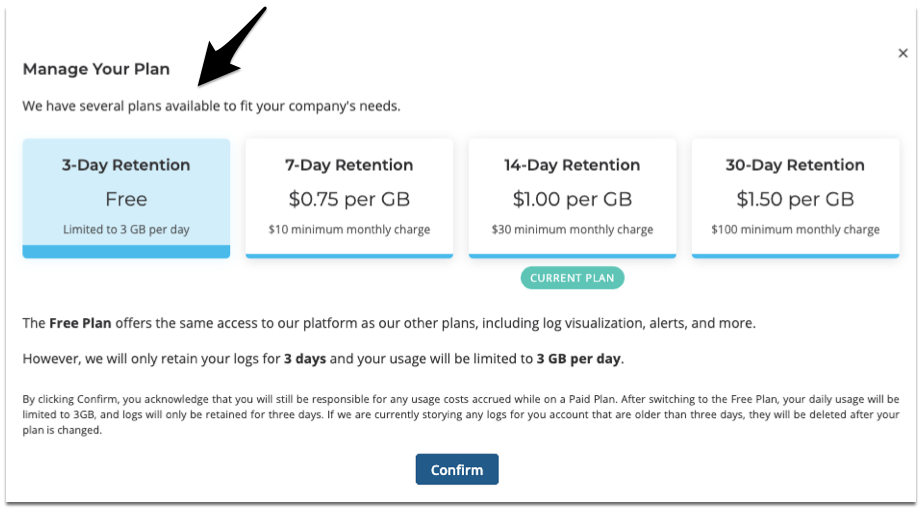
observIQ Pricing Tiers
What Can I Do With The observIQ Free Plan?
Gather, Parse, and Ship your logs to observIQ in Less Than 5 Minutes
Setup is straightforward – end-to-end setup can take as little as 5 minutes for most users. To get started, follow the setup instructions in our docs. TLDR, there are three simple steps:
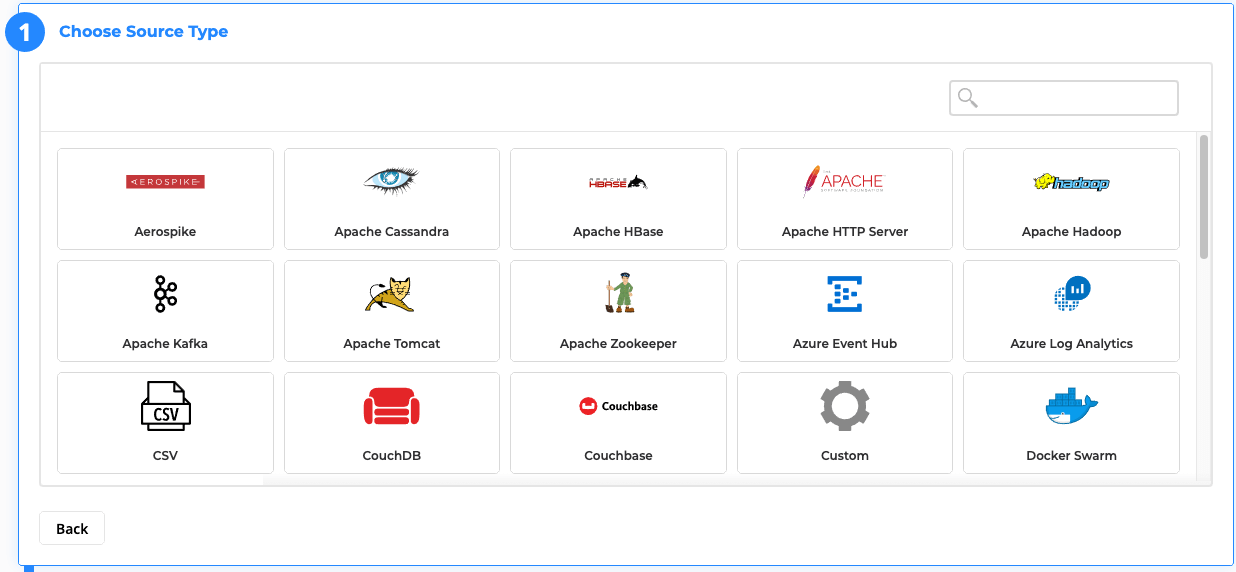
Utilize Over 40 Built-in Sources
Out of the box, observIQ offers more than 40 different Sources to add your Agents. You can see a complete list of supported Sources on our integrations page: https://observiq.com/integrations/
observIQ Integrations List
Just so you’re aware, a Source in observIQ is a pre-made parsing pipeline for the targeted technology. The pipeline contains parsing rules and provides the observIQ agent instructions on which files must be read. The raw pipeline is hidden from the user; the user only verifies the file path and uncomplicated configuration options as a part of the Source configuration – the observIQ agent does the rest. Below are some of the most popular Sources you can utilize:
Generic Sources
Specialized Sources
Explore Your Logs With Powerful Search and Dynamic Filters
After you’ve shipped your logs to observIQ, you can use the Explore page to search and filter your logs to identify and investigate incidents in your environment. The dynamic filter bar allows you to easily search your logs by Severity, Agent, Source, or Type to cut through any noise and find the events you’re looking for.

Search and Dynamic Filter bar on the Explore page
Visualize Your Logs With Pre-made Dashboards
For many Sources in observIQ, a pre-made source-specific dashboard will automatically be deployed to your account as soon as the Source is created and added to your Agent. Dashboards provide insight into the health of your environment at a glance and are the perfect starting point for incident investigation. Kubernetes, Windows, NGINX, and Syslog are just examples of sources with pre-made dashboards. You can find a complete list of dashboards here.
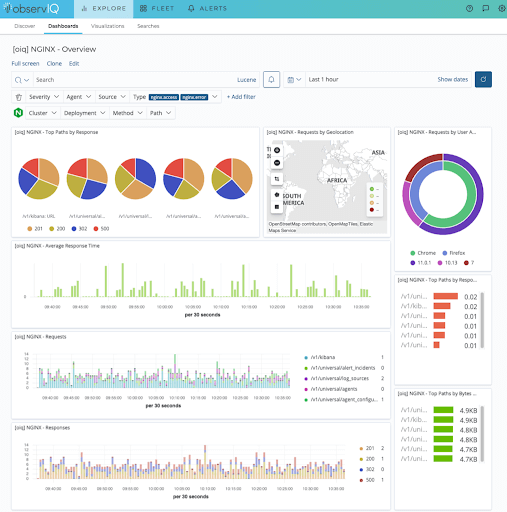
[oiq] NGINX – Overview Dashboard, automatically deployed
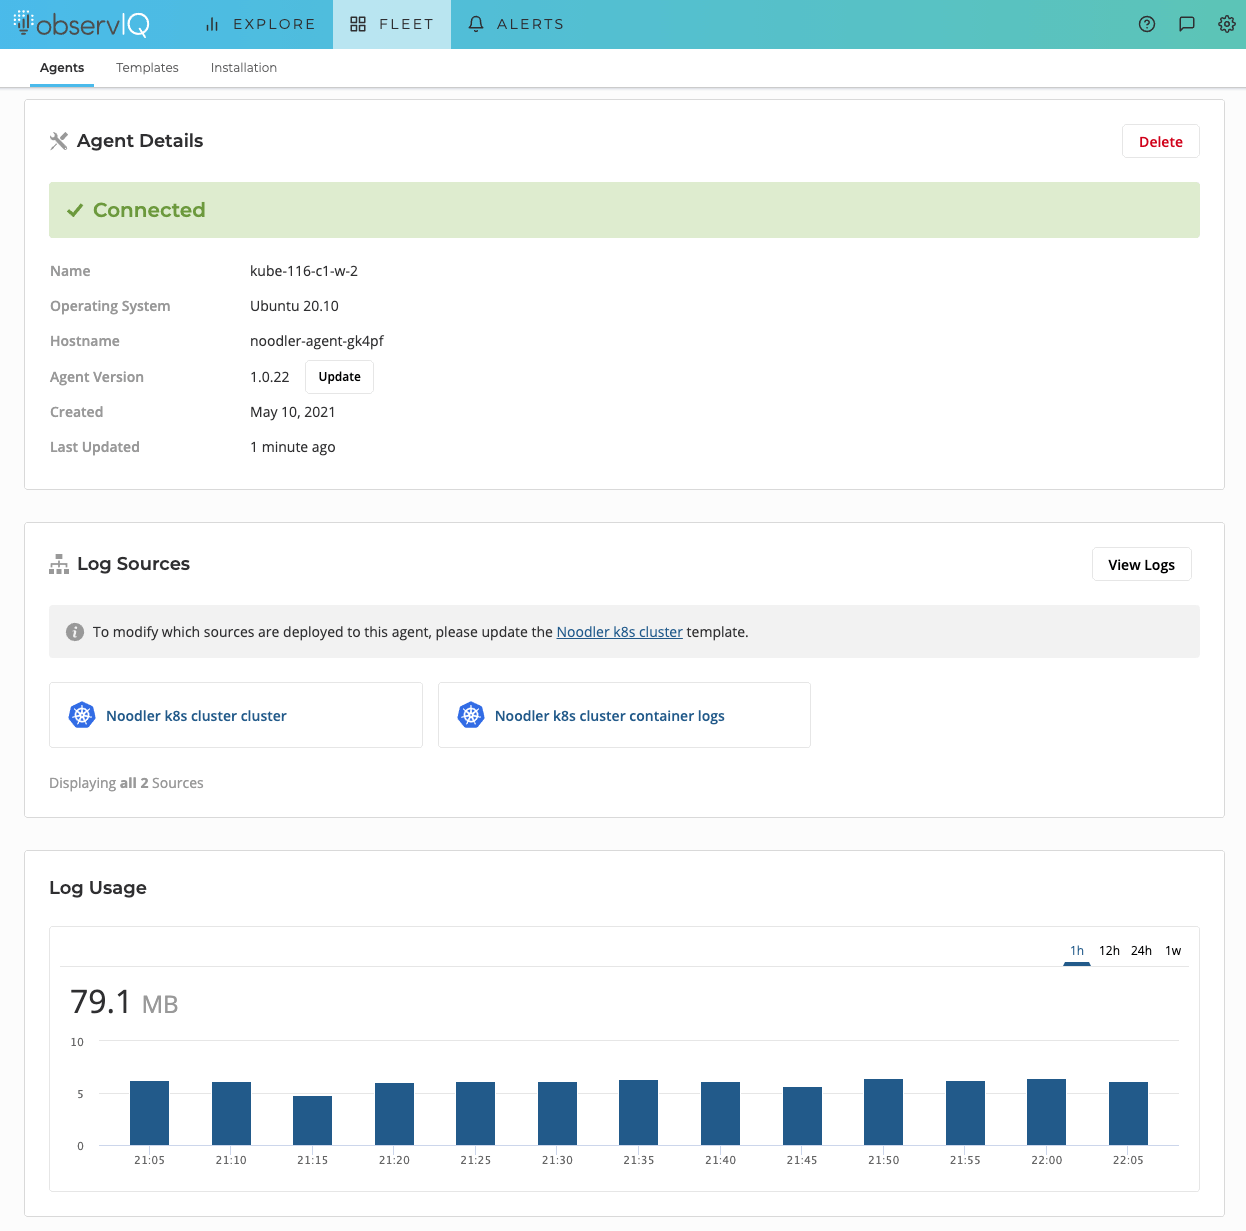
Manage the Lifecycle of Your Agents From Fleet
From the Fleet page, you can manage the lifecycle of your Agents and Sources – all from the comfort of the UI. You can install, update, modify, and delete without digging into configuration files. You can also track Agent health and keep tabs on per-agent log usage.
Create Threshold-based Alerts – Notify Your Existing Channels
With the free plan, you can also create threshold-based alerts with your log data. Using Search and Filters, you can define an alert directly from the Explore page in observIQ and avoid alert fatigue using customizable frequency controls. You can also utilize Notifiers to notify Email, Slack, or Pagerduty when an alert triggers – allowing you to incorporate them into your existing workflow.
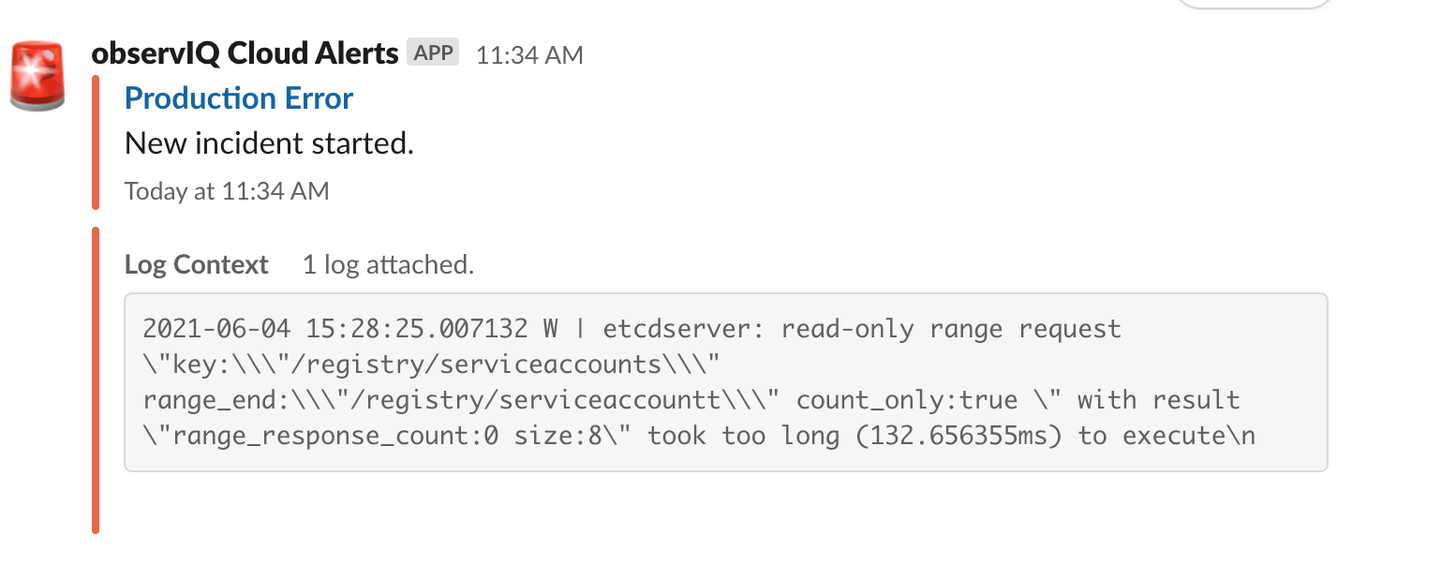
observIQ Alert definition firing a notification in Slack
Debug Live with Live Tail
With the free plan, you’ll also have full access to observIQ’s Live Tail functionality. Live Tail allows you to stream and analyze your logs in real-time without SSH or RDP into a specific system and run tail-f and grep.
If you’re running Kubernetes, Live Tail is an excellent replacement for tools like Kubetail or Kail, allowing you to quickly tail your logs from a specific deployment, daemons, or pod with dynamic filters.
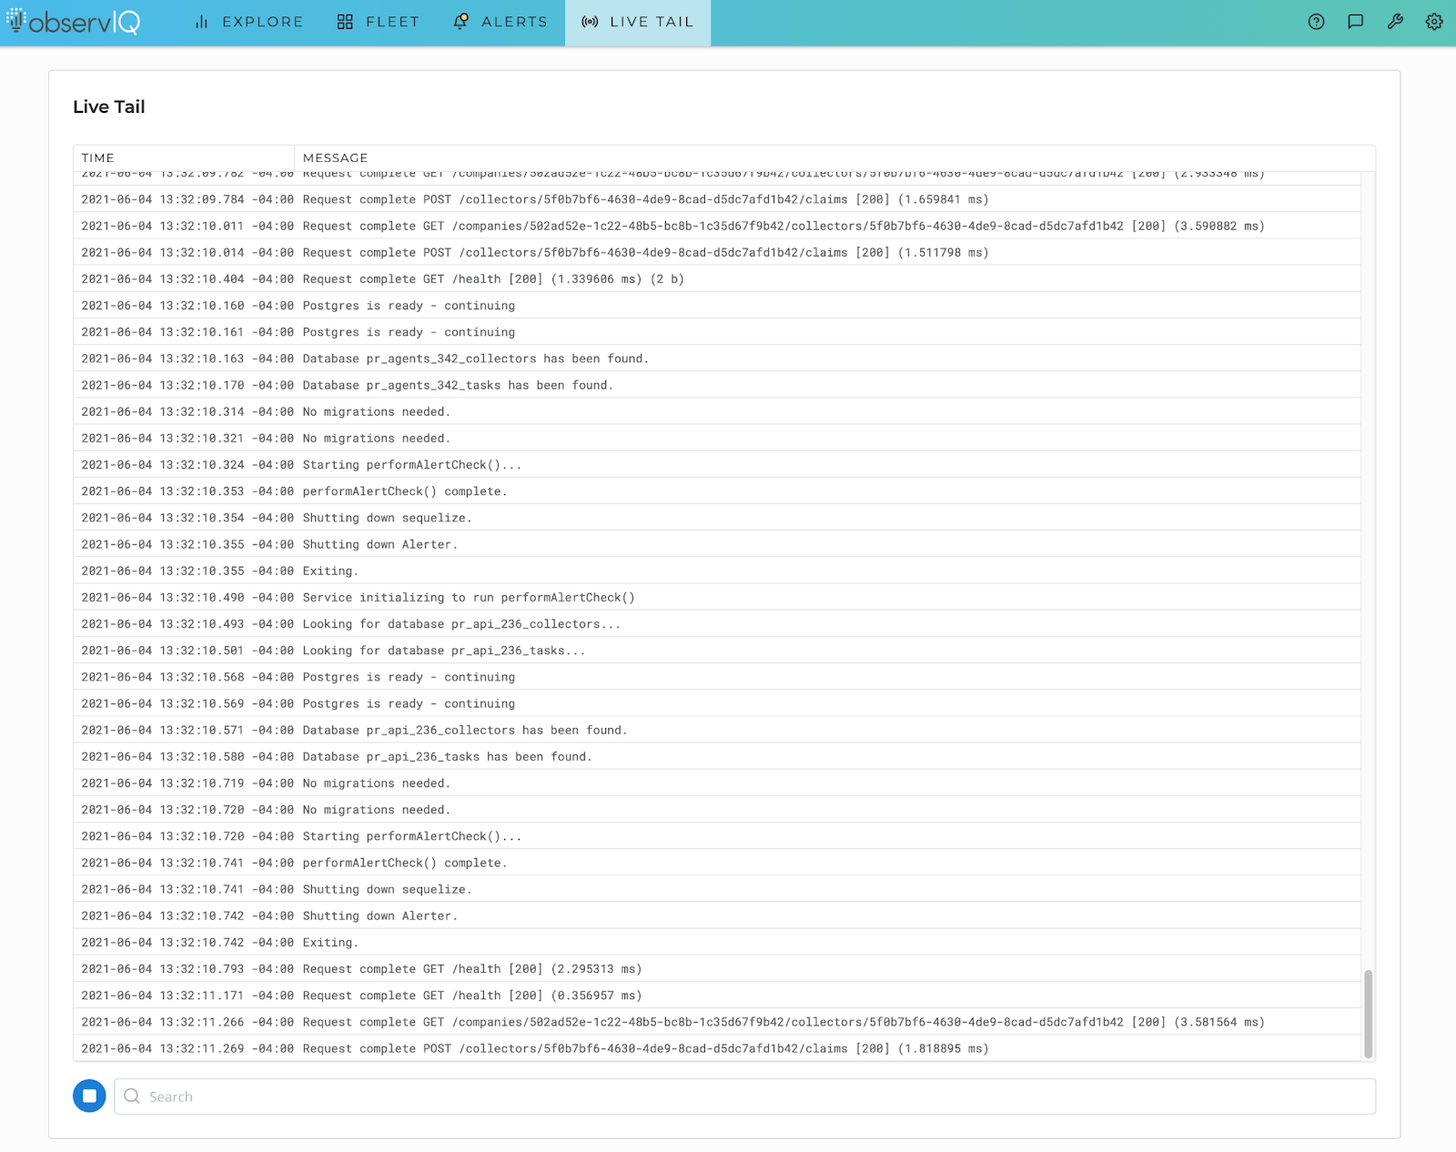
Live tailing Kubernetes container logs.
Why Choose the observIQ Free Plan?
ObservIQ provides simple yet powerful hosted log management, and the free plan makes it accessible to individual users, enthusiasts, and professionals alike – quite simply, you’ve got nothing to lose. With 3 gigabytes of ingestion and 3 days of retention, you can monitor your environment's health, investigate incidents, and alert on undesirable behavior.
Suppose you’re interested in integrating a log management solution in your stack. In that case, you can save time and money by checking out the free plan, avoiding the potential headache of manually configuring log agents, and standing up and maintaining your logging backend.
For a free plan, sign up for your account and select the 3-day plan on the billing.