How to Monitor Cloudflare with OpenTelemetry
With observIQ’s latest contributions to OpenTelemetry, you can now use free open source tools to easily monitor Cloudflare. The easiest way to use the latest OpenTelemetry tools is with observIQ’s distribution of the OpenTelemetry collector. You can find it here.
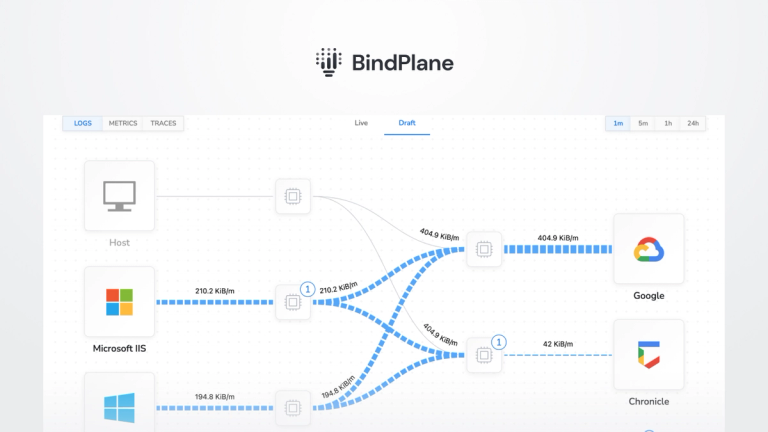
In this blog, the Cloudflare receiver is configured to monitor logs locally with OTLP– you can use the receiver to ship logs to many popular analysis tools, including Google Cloud, New Relic, OTLP, Grafana, and more.
What signals matter?
Cloudflare is a web infrastructure company that provides a variety of services to websites and internet applications including content delivery, DDoS protection, SSL encryption, domain registration, and more. The receiver collects logs by accepting log uploads from a LogPush job configured via the Cloudflare API. https://developers.cloudflare.com/logs/about/
- LogPush is only available to sites on a Cloudflare Enterprise Plan
- The receiver supports all of the datasets supported by LogPush jobs (http_requests, spectrum_events, firewall_events, nel_reports, dns_logs, for example), so whatever activity a user is looking for from Cloudflare is available. For example, you can monitor http_requests for insight into server error frequency, request throughput, request origin trends, etc.
Installing the Receiver
If you don’t already have an OpenTelemetry collector built with the latest Cloudflare receiver installed, we suggest using the observIQ OpenTelemetry Collector distro that includes the Cloudflare receiver (and many others). Installation is simple with our one-line installer. Come back to this blog after running the install command on your source.
Configuring the Receiver
Navigate to your OpenTelemetry configuration file. If you’re using the observIQ Collector, you’ll find it in one of the following location:
- /opt/observiq-otel-collector/config.yaml (Linux)
- C:Program FilesGoogleCloud OperationsOps Agentconfigconfig.yaml (Windows)
Edit the configuration file to include the Cloudflare receiver, as shown in the example below. Detailed instructions for configuring Cloudflare monitoring can be found here on GitHub. A couple of items to keep in mind:
- Cloudflare requires that a LogPush endpoint supports HTTPS, so a fully valid (not self-signed) SSL certificate is absolutely required.
- The receiver has to be set up and running before configuring the LogPush job, at this point, Cloudflare will send a “test” message to the receiver to confirm the configuration.
1receivers:
2  cloudflare:
3    logs:
4      tls:
5        key_file: some_key_file
6        cert_file: some_cert_file
7      endpoint: 0.0.0.0:12345
8      secret: 1234567890abcdef1234567890abcdef
9      timestamp_field: EdgeStartTimestamp
10      attributes:
11        ClientIP: http_request.client_ip
12 ClientRequestURI: http_request.uriFollow this space to keep up with all our future posts and simplified configurations for various sources. For questions, requests, and suggestions, reach out to our support team at support@observIQ.com or join our open-source community Slack Channel.