How to Monitor JVM with OpenTelemetry

The Java Virtual Machine (JVM) is an important part of the Java programming language, allowing applications to run on any device with the JVM, regardless of the hardware and operating system. It interprets Java bytecode and manages memory, garbage collection, and performance optimization to ensure smooth execution and scalability.
Effective JVM monitoring is critical for performance and stability. This is where OpenTelemetry comes into play.
OpenTelemetry's Role
OpenTelemetry is a tool for monitoring and diagnosing the performance of distributed systems. It collects and processes telemetry data like metrics, logs, and traces, helping developers understand their applications, identify bottlenecks, and improve performance and reliability.
We are continuously adding monitoring support for different sources. The latest addition is support for JVM monitoring using the OpenTelemetry collector. You can find more details about this support in OpenTelemetry’s repository.
The best part is that this receiver works with any OpenTelemetry Collector, including the OpenTelemetry Collector and observIQ’s distribution of the collector.
Let us guide you through setting up this receiver with observIQ’s distribution of the OpenTelemetry Collector and sending the metrics to Google Cloud Operations.
Here, JVM monitoring is managed using the JMX metrics receiver from OpenTelemetry.
Monitor JVM with OpenTelemetry
Performance metrics are the most important to monitor for JVM. Here’s a list of signals to keep track of:
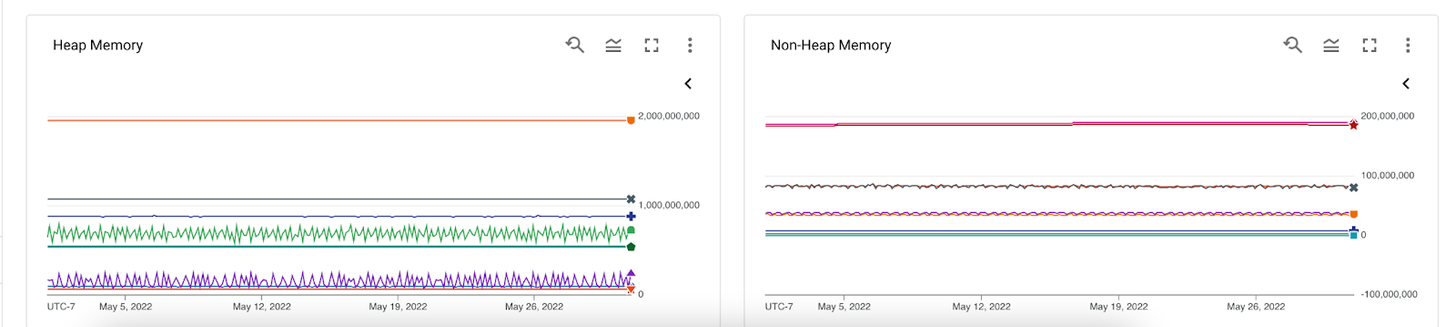
Heap Memory:
It's important to keep an eye on heap memory to understand how your application manages memory when the traffic accessing your application changes. Heap memory is where the application stores objects. Depending on the number of users, the heap keeps objects related to requests. After the request is completed, the heap memory is supposed to clear these objects. If this doesn't happen as expected due to coding issues or lack of scalability, the problem needs to be identified and addressed before it causes the application to crash. Metrics such as jvm.memory.heap. help keep track of the total heap memory used at any given time.
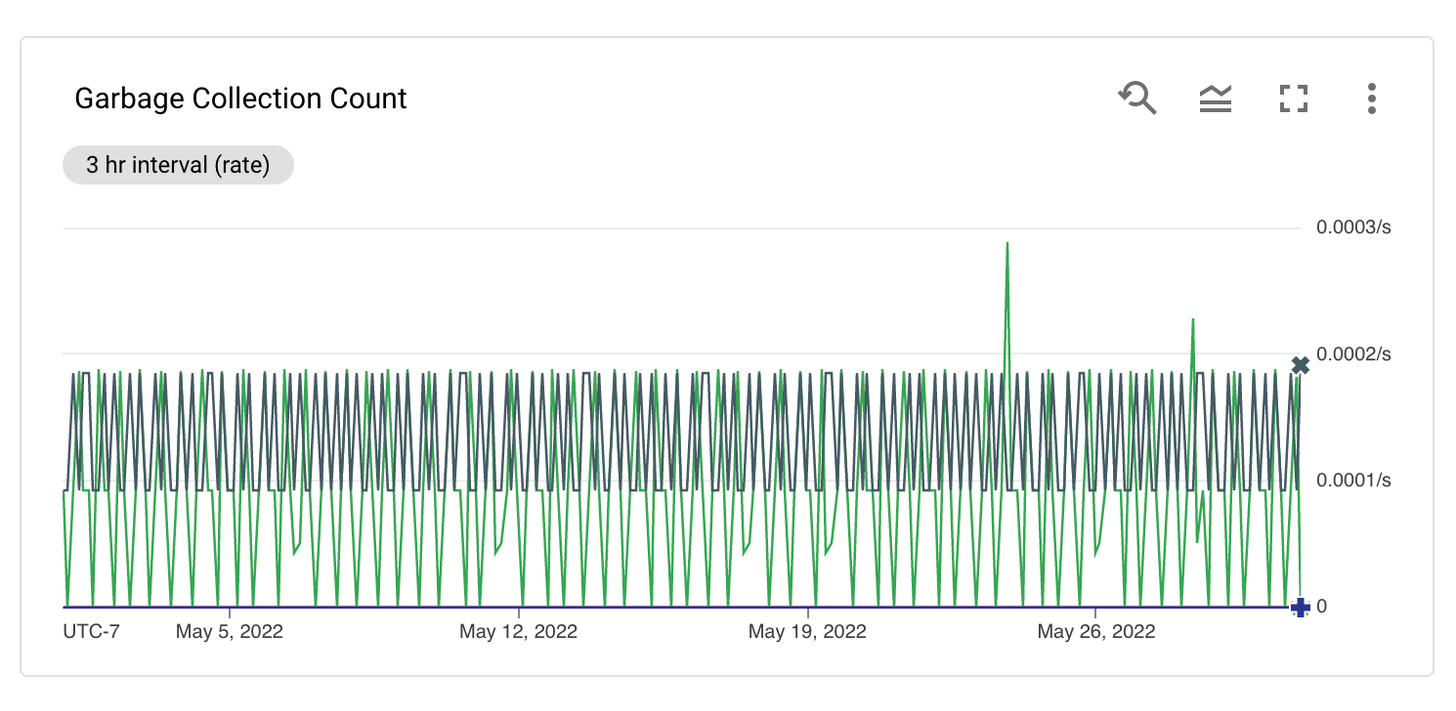
Garbage Collection:
Once the heap memory no longer references the serviced request objects, the objects are cleaned out from the heap memory using the Garbage collection process. When garbage collection happens, the application performs poorly, leading to slower responsiveness. Therefore, making the garbage collection process shorter and faster is important for better application performance. Metrics such as jvm.gc.collections.count provide the total count of garbage collections at specific intervals.
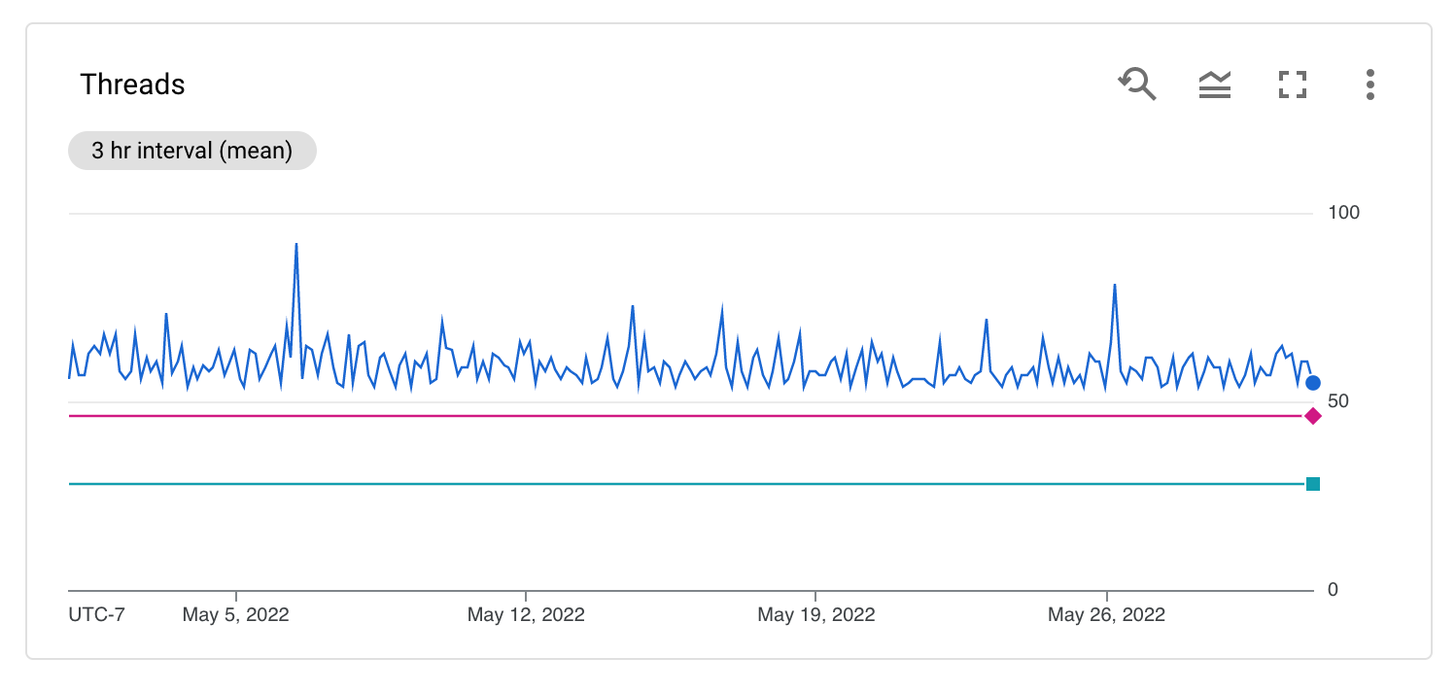
Threads:
Monitoring the active thread count in the JVM is crucial. A higher active thread count can slow down the application. Having more threads puts greater demand on application resources like the processor and server utilization. By analyzing the thread count over time, you can determine the best thread count based on varying request traffic. It's important to adjust the number of threads based on changing traffic levels in the application. Metrics such as jvm.memory.pool.init gives information about the thread count at specified intervals.
Configuring the JMX Metrics Receiver
After the installation, you can find the configuration file for the collector at:
- C:\Program Files\observIQ OpenTelemetry Collector\config.yaml (Windows)
- /opt/observiq-otel-collector/config.yaml(Linux)
The first step is building the receiver’s configuration:
- We are using the JMX receiver to gather JVM metrics. The jar_path attribute allows you to specify the path to the jar file for gathering JVM metrics using the JMX receiver. This file path is automatically created when observIQ’s distribution of the OpenTelemetry Collector is installed.
- You should set the IP address and port for the system from which the metrics are collected as the endpoint.
- When we connect to JMX, there are different categories of metrics; this configuration is intended to scrape the JVM metrics. This target_system attribute specifies that.
- Set the time for fetching the metrics using the collection_interval attribute. The default value for this parameter is 10 seconds. However, if metrics are exported to Google Cloud operations, this value is set to 60 seconds by default.
- The properties attribute allows you to set arbitrary attributes. For instance, if you are configuring multiple JMX receivers to collect metrics from many JVM servers, this attribute enables you to set unique IP addresses for each endpoint system. Please note that this is not the only use of the properties option.
1receivers:
2 jmx:
3   jar_path: /opt/opentelemetry-java-contrib-jmx-metrics.jar
4   endpoint: localhost:9000
5   target_system: jvm
6   collection_interval: 60s
7   properties:
8     # Attribute 'endpoint' will be used for generic_node's node_id field.
9 otel.resource.attributes: endpoint=localhost:9000The next step is to configure the processors:
- Use the resourcedetection processor to create an identifier for each JVM instance from which the metrics are collected.
- Add the batch processor to group the metrics from multiple receivers. It's important to use this processor in the configuration to benefit the collector's logging component. If you would like to learn more about this processor, check the documentation.
1processors:
2  resourcedetection:
3    detectors: ["system"]
4    system:
5      hostname_sources: ["os"]
6
7 batch:To export the metrics, the next step is to set up a destination. You can find the configuration for your preferred destination in OpenTelemetry’s documentation here.
1exporters:
2  googlecloud:
3    retry_on_failure:
4 enabled: falseSet up the pipeline.
1service:
2  pipelines:
3    metrics:
4      receivers:
5      - jmx
6      processors:
7      - resourcedetection
8      - resourceattributetransposer
9      - resource
10      - batch
11      exporters: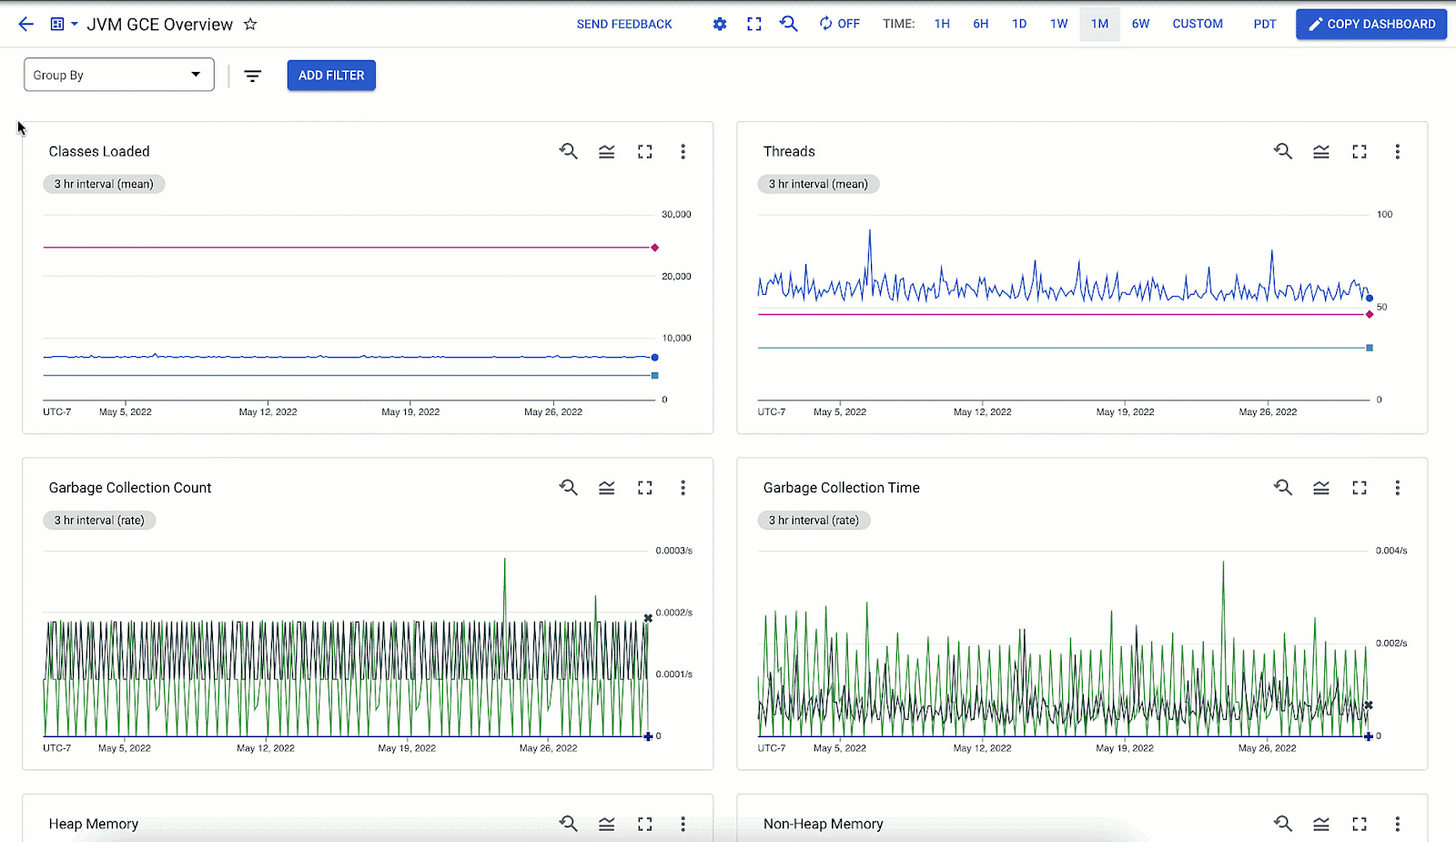
12 - googlecloudViewing and Analyzing JVM Metrics
The JMX metrics gatherer collects the specified metrics and exports them to the destination based on the detailed configuration above.
We've guided you through setting up the JVM metrics receiver using observIQ’s OpenTelemetry Collector to send metrics to Google Cloud Operations. With this setup, you can monitor heap memory, garbage collection, and thread count for JVM performance. By following the steps above, you can ensure accurate collection and export of JVM metrics, enabling you to maintain optimal performance and stability for your Java applications.
For more information, visit OpenTelemetry’s repository. Contact our support team at support@observIQ.com for assistance.
Thank you for following along, and happy monitoring!


