How to Monitor JVM with OpenTelemetry

We are constantly working on contributing monitoring support for various sources; the latest in that line is support for JVM monitoring using the OpenTelemetry collector. If you are as excited as we are, take a look at the details of this support in OpenTelemetry’s repo.
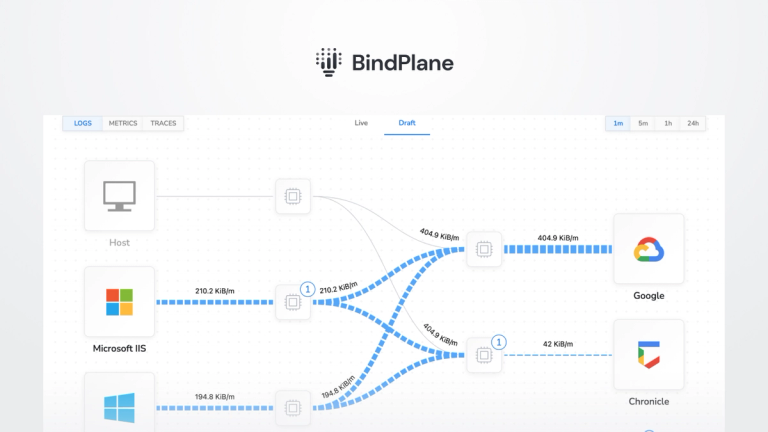
The best part is that this receiver works with any OpenTelemetry Collector, including the OpenTelemetry Collector and observIQ’s distribution of the collector.
In this post, we take you through the steps to set up this receiver with observIQ’s distribution of the OpenTelemetry Collector and send out the metrics to Google Cloud Operations.
Here, JVM monitoring is handled using the JMX metrics receiver from OpenTelemetry.
What signals matter?
Performance metrics are the most important to monitor for JVM. Here’s a list of signals to keep track of:
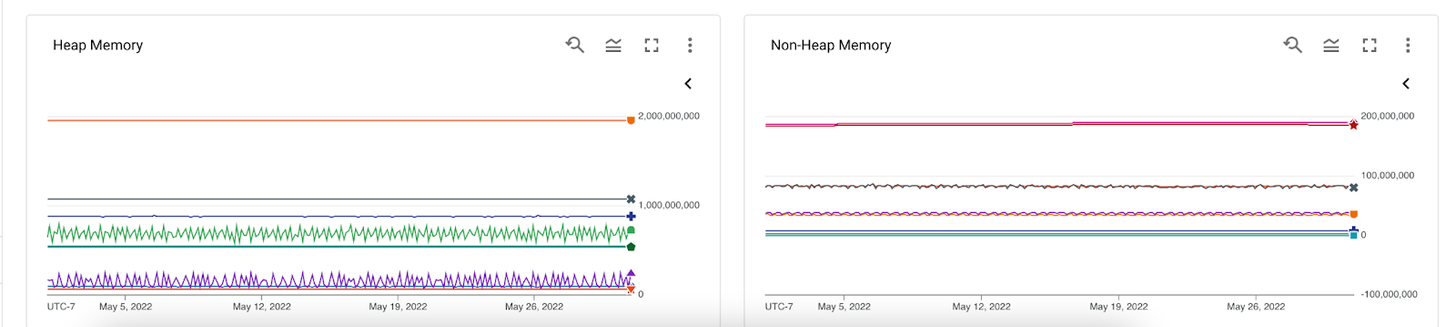
Heap Memory:
Keeping track of the heap memory gives you a clear picture of how your application handles scaling up memory when there is a change in the traffic accessing your application. Heap memory holds the application objects. Based on user volumes, the request-related objects in the heap are retained. When completing the request, heap memory is expected to clear these objects. When this does not happen as expected, either due to coding issues or lack of scalability, it must be identified and addressed before it leads to the application crashing. Metrics such as jvm.memory.heap. help keep track of the total heap memory used at any point in time.
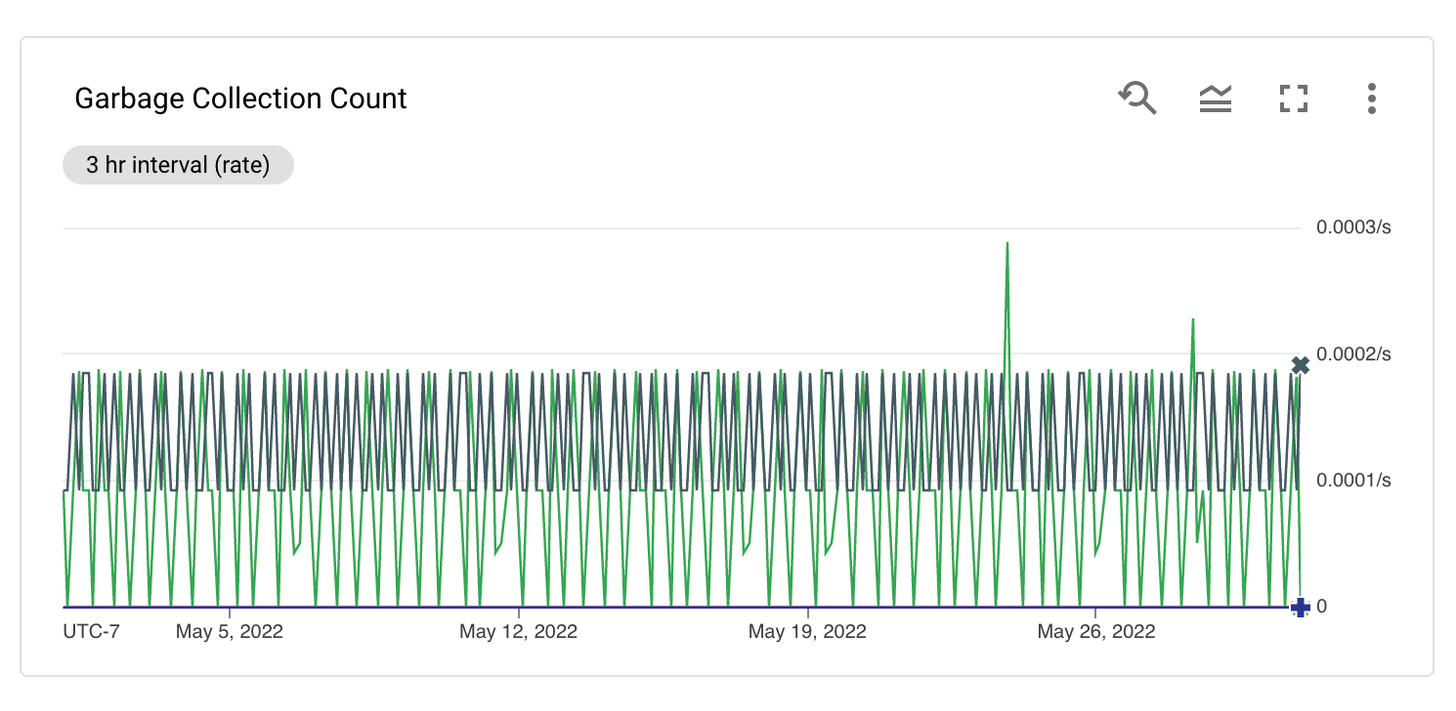
Garbage Collection:
Once Heap memory no longer references the serviced request objects, the objects are cleaned out from the heap memory using the Garbage collection process. When garbage collection happens, the application does not perform to capacity, leading to retarded responsiveness. Hence, it is necessary to keep the garbage collection process shorter and faster for ideal application performance. Metrics such as jvm.gc.collections.count gives a value of the total garbage collection count at the set interval.
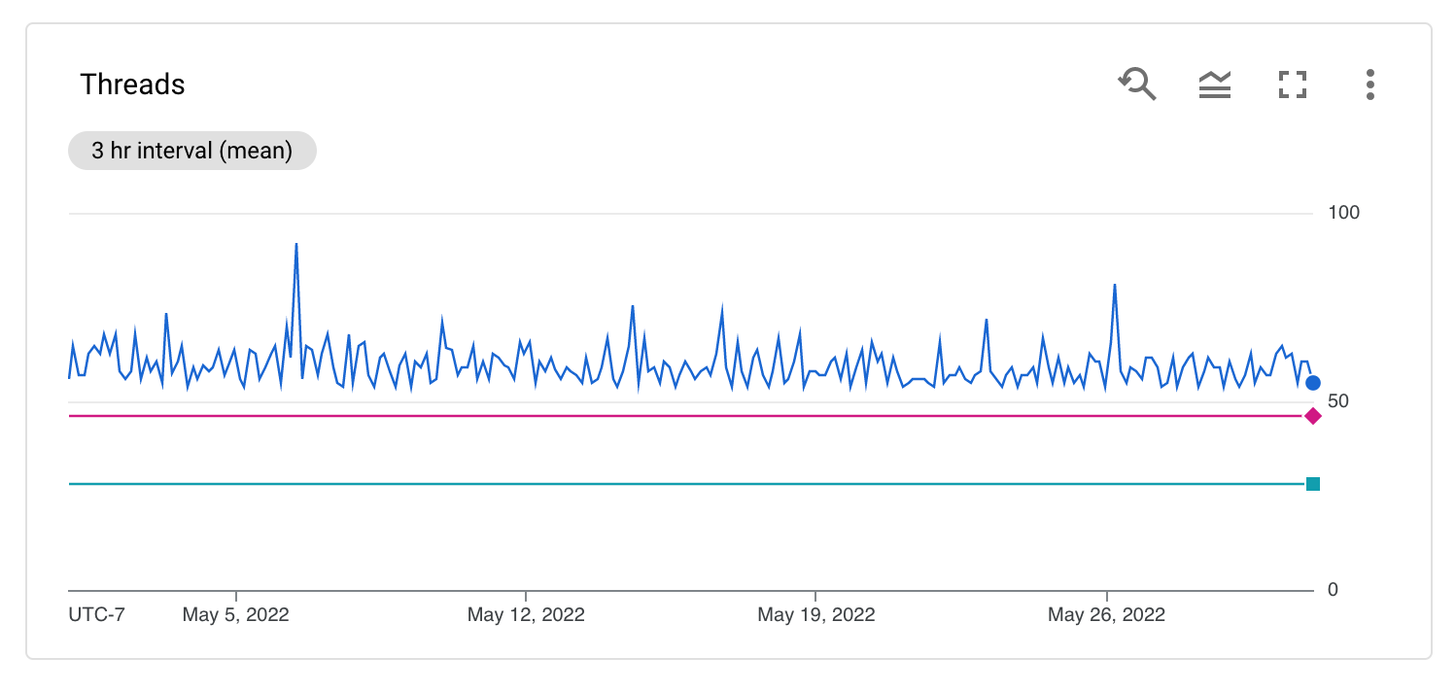
Threads:
A very crucial JVM metric is the active thread count. The higher the active thread count, the slower the application’s performance. Holding more threads increases the dependency on application resources such as processor and server utilization. By analyzing the thread count over a period of time, you should be able to set the optimal thread count based on the request traffic at various times. Increasing and decreasing the number of threads allocated based on varying traffic levels to the application. Metrics such as jvm.memory.pool.init gives the thread count at the specified interval.
Configuring the JMX metrics receiver
After the installation, the config file for the collector can be found at:
- C:\Program Files\observIQ OpenTelemetry Collector\config.yaml (Windows)
- /opt/observiq-otel-collector/config.yaml(Linux)
The first step is building the receiver’s configuration:
- We are using the JMX receiver to gather JVM metrics. The jar_path attribute lets you specify the path to the jar file, which facilitates gathering JVM metrics using the JMX receiver. This file path is created automatically when observIQ’s distribution of the OpenTelemetry Collector is installed.
- Set the IP address and port for the system from which the metrics are gathered as the endpoint.
- When we connect to JMX, there are different categories of metrics; the JVM metrics are the ones that this configuration intends to scrape. This target_system attribute specifies that.
- Set the time interval for fetching the metrics for the collection_interval attribute. The default value for this parameter is 10s. However, if exporting metrics to Google Cloud operations, this value is set to 60s by default.
- The Properties attribute allows you to set arbitrary attributes. For instance, if you are configuring multiple JMX receivers to collect metrics from many JVM servers, this attribute enables you to set the unique IP addresses for each endpoint system. Please note that this is not the only use of the properties option.
1receivers:
2 jmx:
3   jar_path: /opt/opentelemetry-java-contrib-jmx-metrics.jar
4   endpoint: localhost:9000
5   target_system: jvm
6   collection_interval: 60s
7   properties:
8     # Attribute 'endpoint' will be used for generic_node's node_id field.
9 otel.resource.attributes: endpoint=localhost:9000The next step is to configure the processors:
- Use the resourcedetection processor to create an identifier value for each JVM instance from which the metrics are scraped.
- Add the batch processor to bundle the metrics from multiple receivers. We highly recommend using this processor in the configuration, especially for the benefit of the collector's logging component. If you would like to learn more about this processor check the documentation.
1processors:
2  resourcedetection:
3    detectors: ["system"]
4    system:
5      hostname_sources: ["os"]
6
7 batch:The next step is to set up a destination for exporting the metrics, as shown below. You can check the configuration for your preferred destination from OpenTelemetry’s documentation here.
1exporters:
2  googlecloud:
3    retry_on_failure:
4 enabled: falseSet up the pipeline.
1service:
2  pipelines:
3    metrics:
4      receivers:
5      - jmx
6      processors:
7      - resourcedetection
8      - resourceattributetransposer
9      - resource
10      - batch
11      exporters: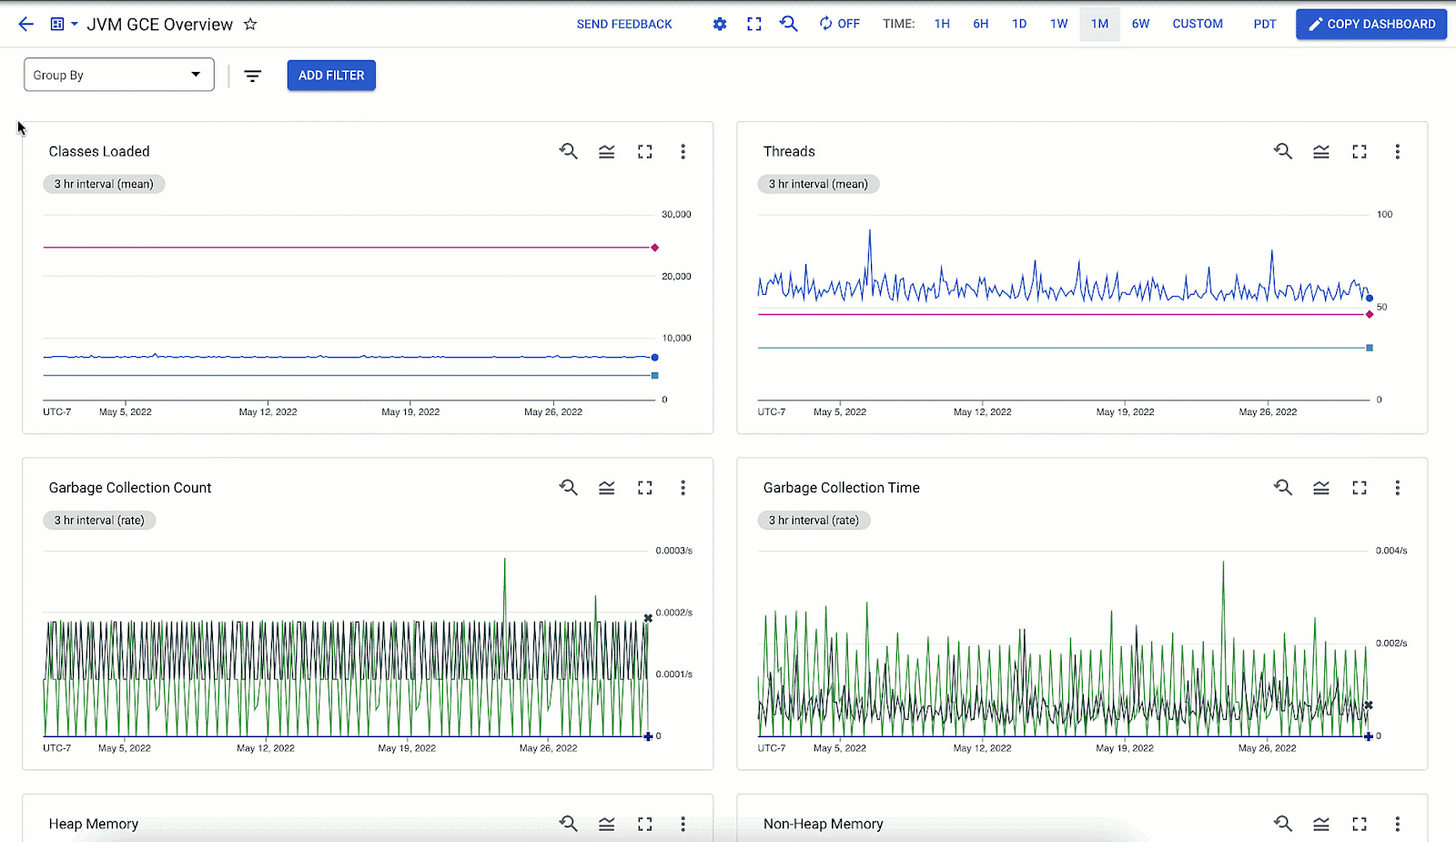
12 - googlecloudViewing the metrics collected
The JMX metrics gatherer scrapes the following metrics and exports them to the destination based on the configuration detailed above.
observIQ’s distribution is a game-changer for companies looking to implement the OpenTelemetry standards. The single-line installer, seamlessly integrated receivers, exporter, and processor pool make working with this collector simple. Follow this space to keep up with all our future posts and simplified configurations for various sources. For questions, requests, and suggestions, contact our support team at support@observIQ.com.