How to Reduce Data Costs with OpenTelemetry and BindPlane OP
Data costs fill a large column in many organizations’ accounting sheets. Data pipeline setup and management is a significant time sink for DevOps, IT, and SRE. Setting up telemetry pipelines to reduce unwanted data often takes even more time, which could better be spent creating value rather than reducing costs. This blog will show you how to quickly set up your data pipeline to filter unnecessary telemetry data.
Getting Started with OpenTelemetry and BindPlane OP
BindPlane OP is an open-source tool for managing telemetry data pipelines. If you’re already using the observIQ distribution of OpenTelemetry, but haven’t used BindPlane OP to manage your agents and sources, follow this 2-minute guide on connecting existing OpenTelemetry deployments to BindPlane OP. If starting from scratch, visit the BindPlane OP GitHub page or the BindPlane OP Documentation for easy setup instructions (~3 minute setup from start to shipping telemetry).
BindPlane OP works on MacOS, Windows, and Linux. It’s vendor-agnostic so that you can use any integrated source and destination. Here, you can find an updated list of supported sources and destinations. New integrations are added frequently, so check with us in the BindPlane OP Slack if you don’t see what you’re looking for. BindPlane OP is the first telemetry pipeline built to work natively with OpenTelemetry.
Using Snapshot to Sample Data
You can sample logs directly from BindPlane OP without needing an analysis tool. Sampling logs with Snapshot is an excellent way to scan a source for unwanted or noisy data generation. The steps for using Snapshot are simple:
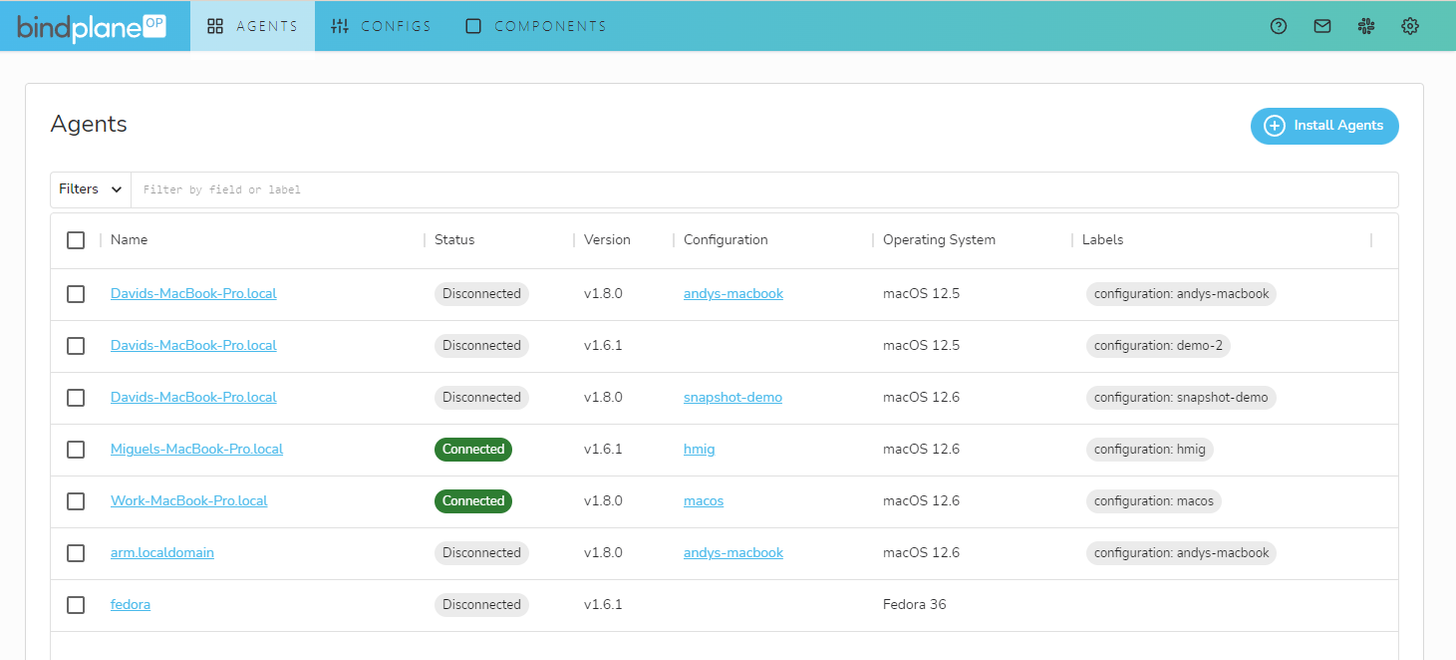
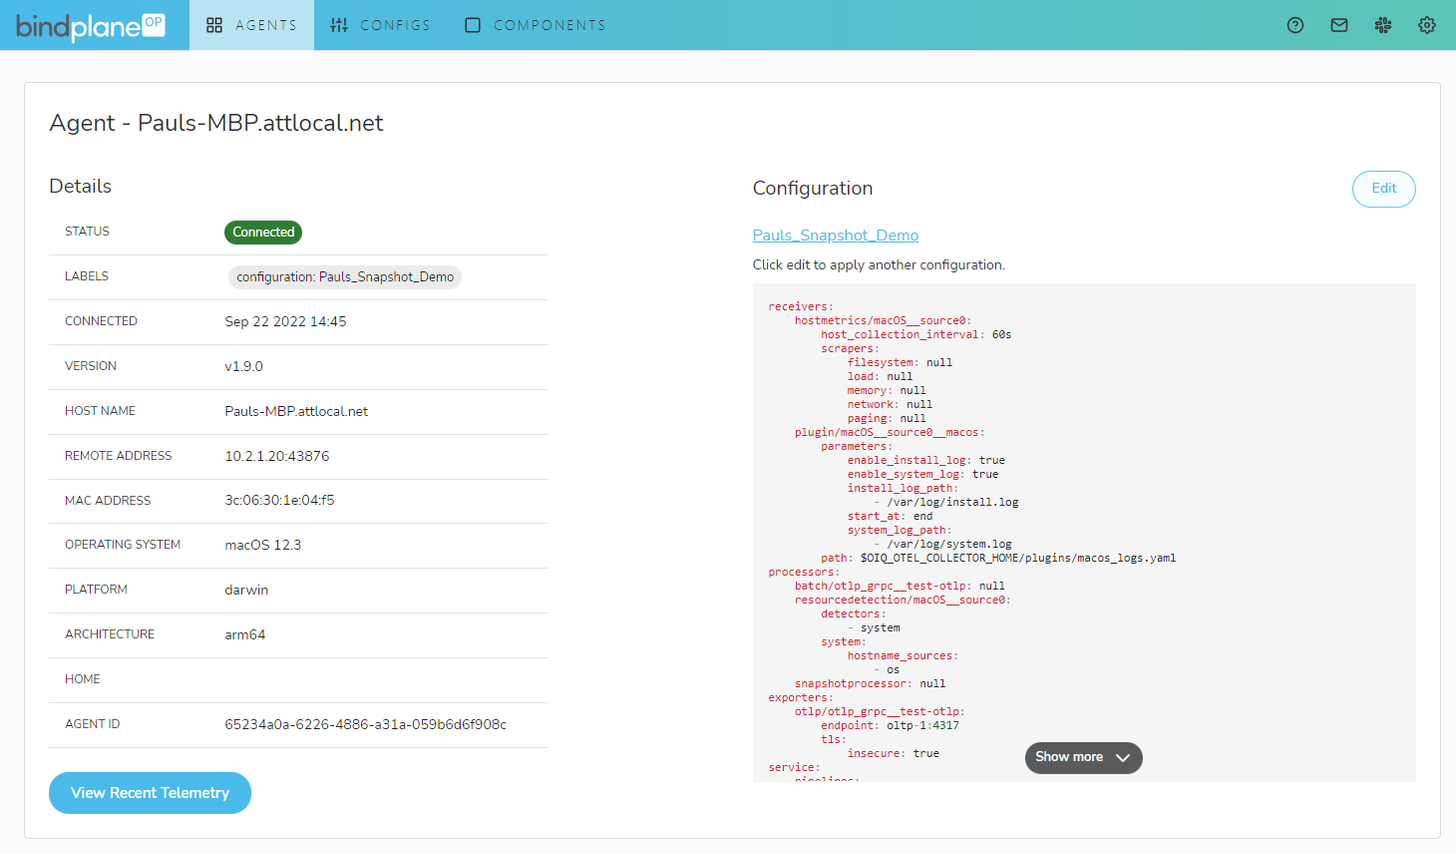
- Go to the Agents tab and click on the agent you want to Snapshot
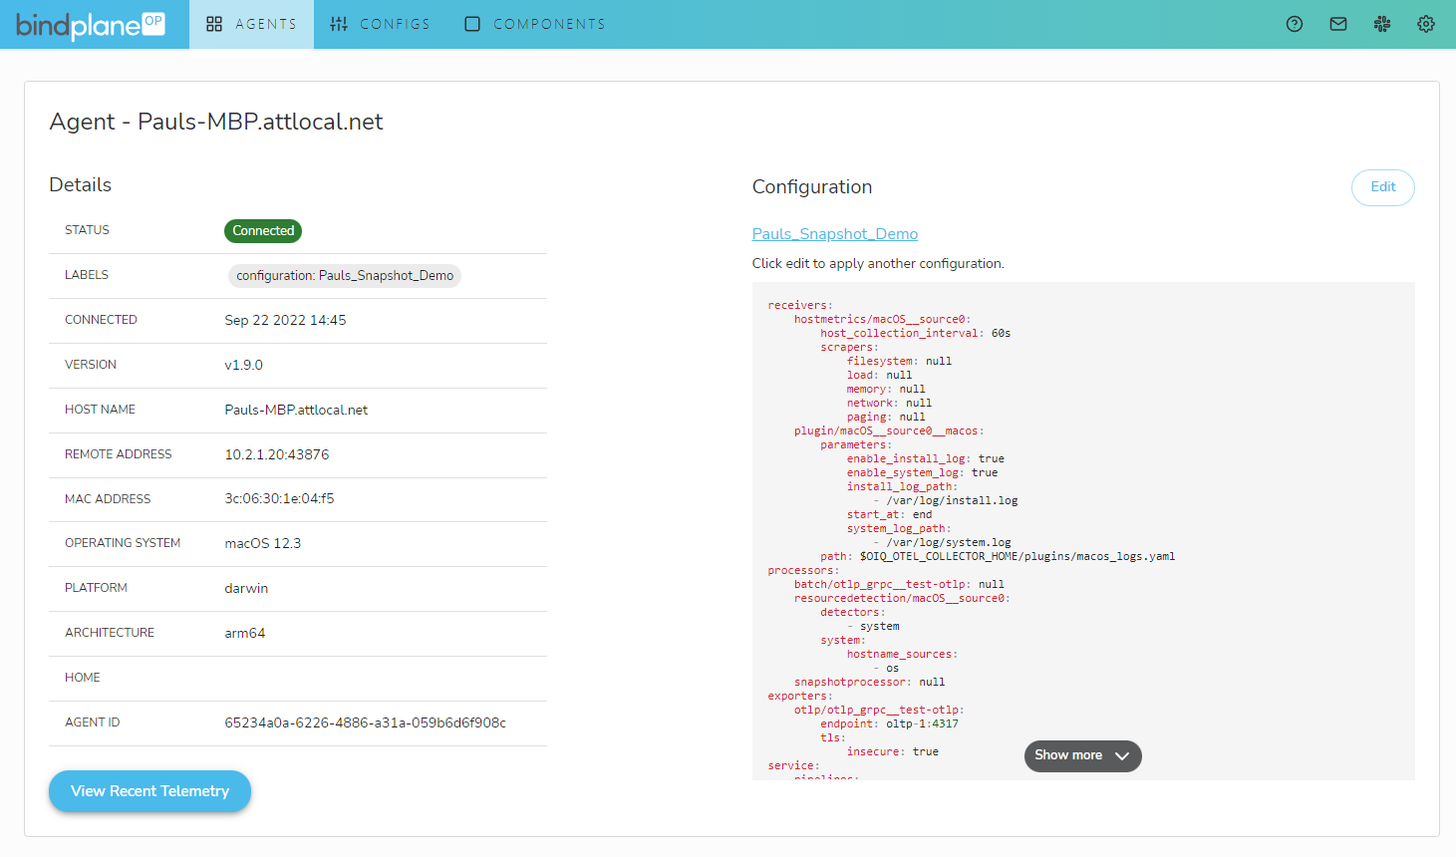
2. Click “View Recent Telemetry” in the bottom left of the agent details
- Note: if the button is grayed out, make sure your agent is updated (an update button will appear next to the “VERSION” row in Details, and that the agent is running a configuration from your CONFIGS tab. Click “Edit” at the top right to add a config template from the CONFIGS tab.
3. Snapshot will display the last 100 log messages, the most recent batch of metrics, and traces.
- You can hit the refresh button on the top right to update the Snapshot.
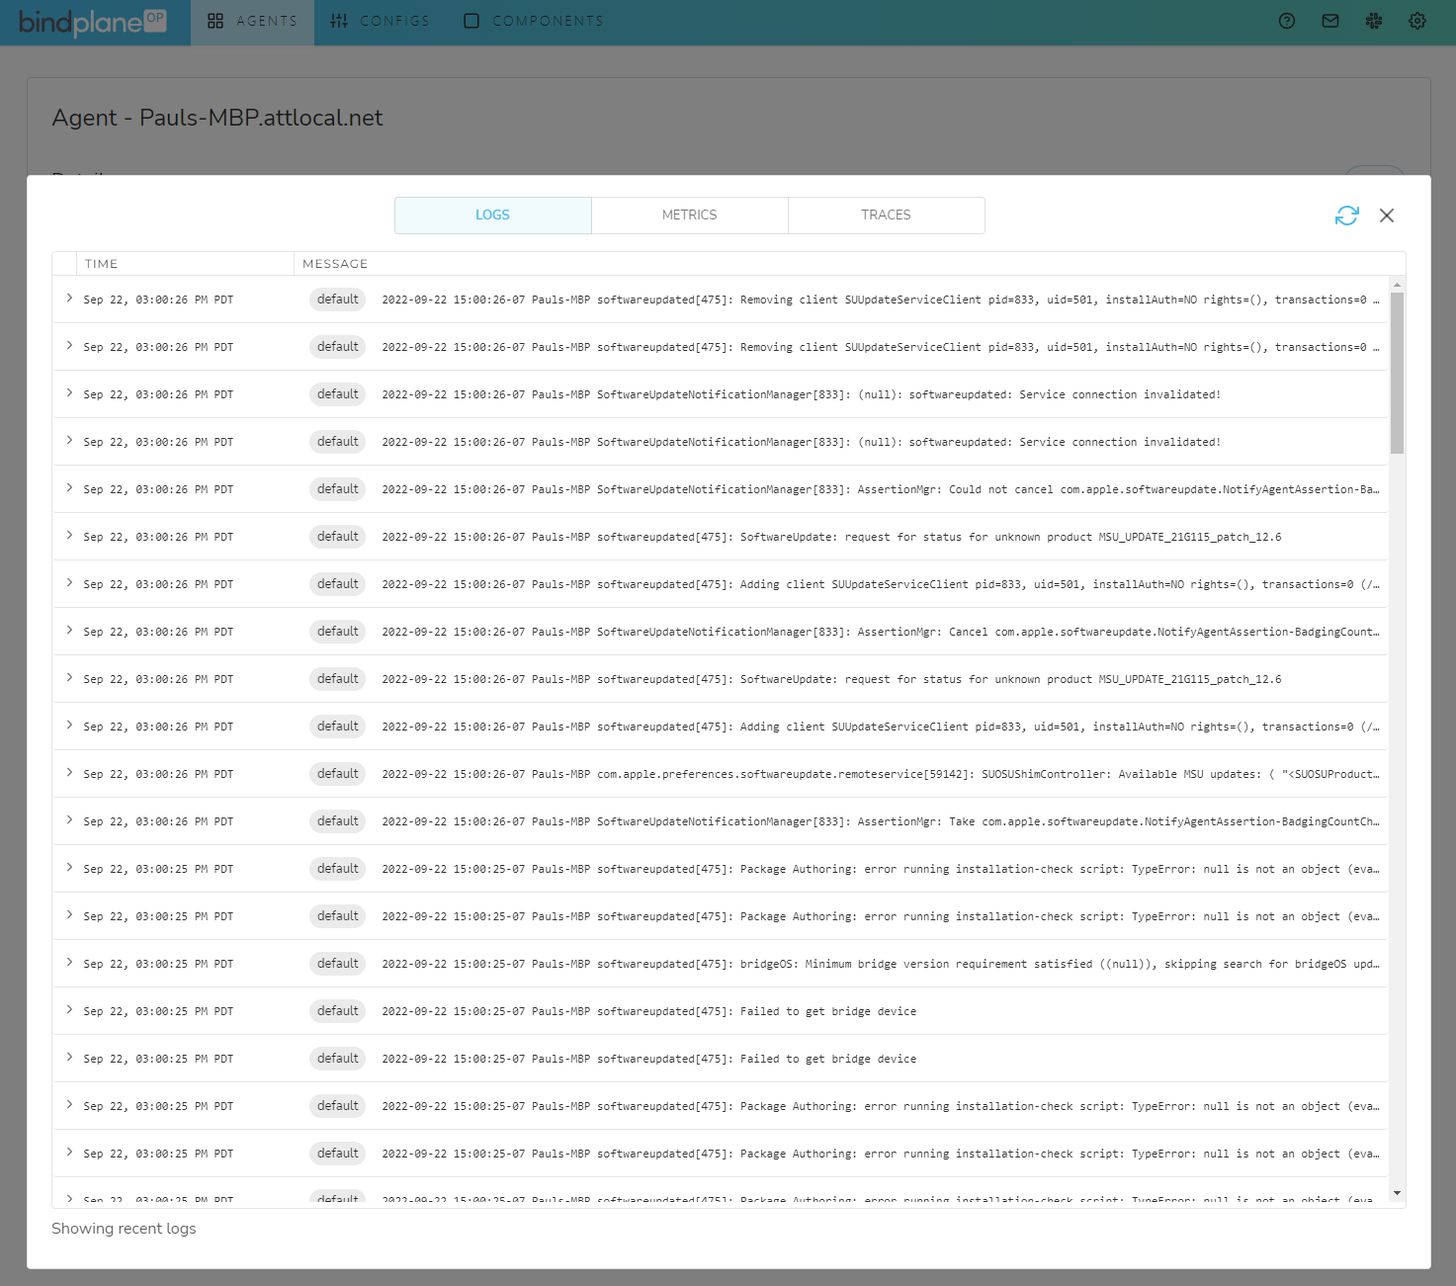
- To expand a log message, click on the carrot on the left.
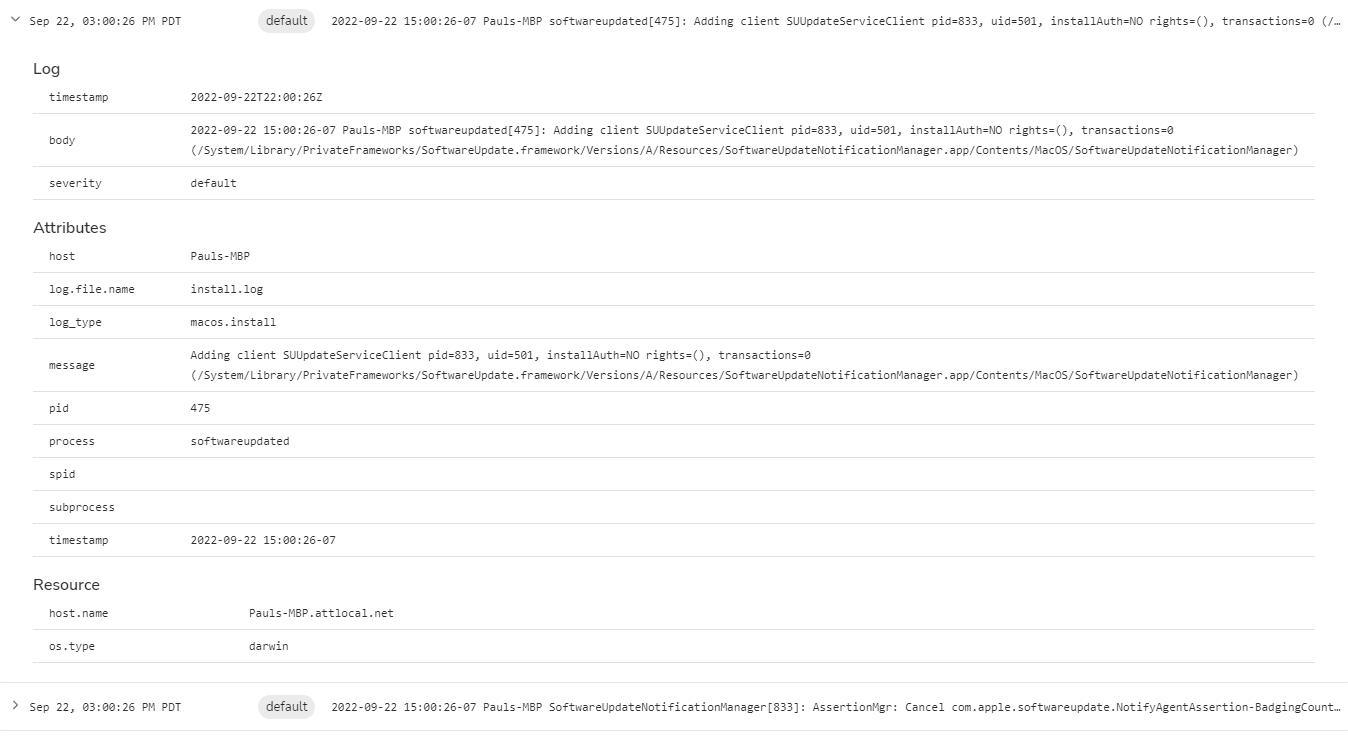
4. Select a log you would like to reduce or exclude. You can exclude or limit the volume of logs based on any field in the log message.
With Snapshot, you can quickly identify log messages and metrics you want to reduce or filter. Once you’ve identified the necessary, redundant, or noisy data, copy the details onto a notepad or take a screenshot to inform your processor configuration.
Using Processors to Filter Telemetry Data and Reduce Costs
Processors enable OpenTelemetry agents to filter data and reduce data flow, which can dramatically reduce ingestion and analysis costs. The following steps will show how to add a processor to filter telemetry with the information collected from Snapshot.
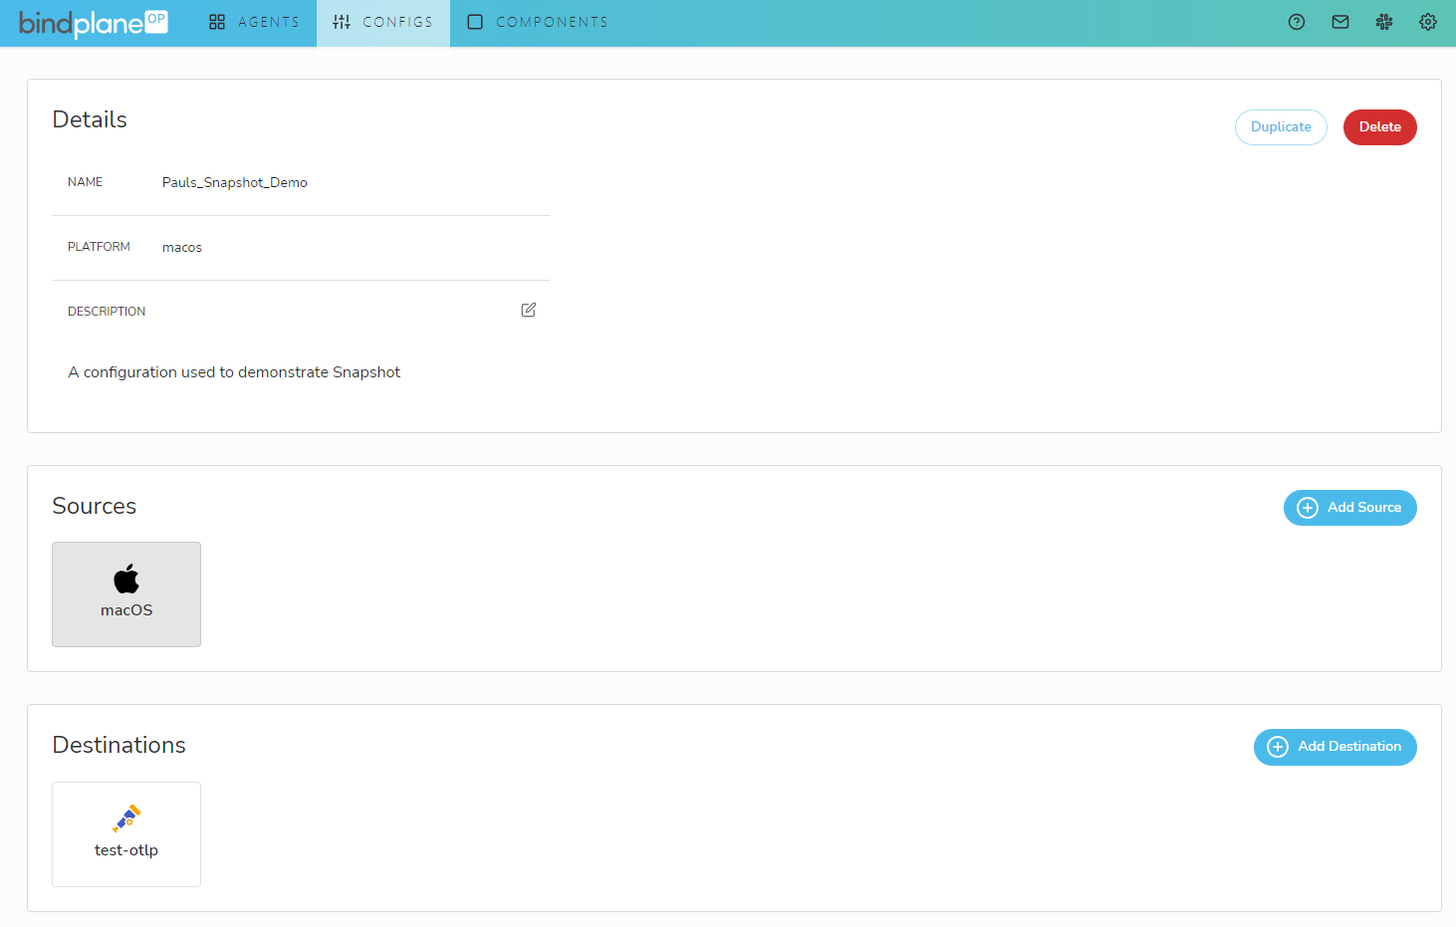
- On the agent page to which you want to add the processor, click the Configuration name on the right. That will take you directly to the edit page for that configuration.
2. On the configuration page, click the source you want to add processors to
3. In the pop-up, click “Add processor” at the bottom
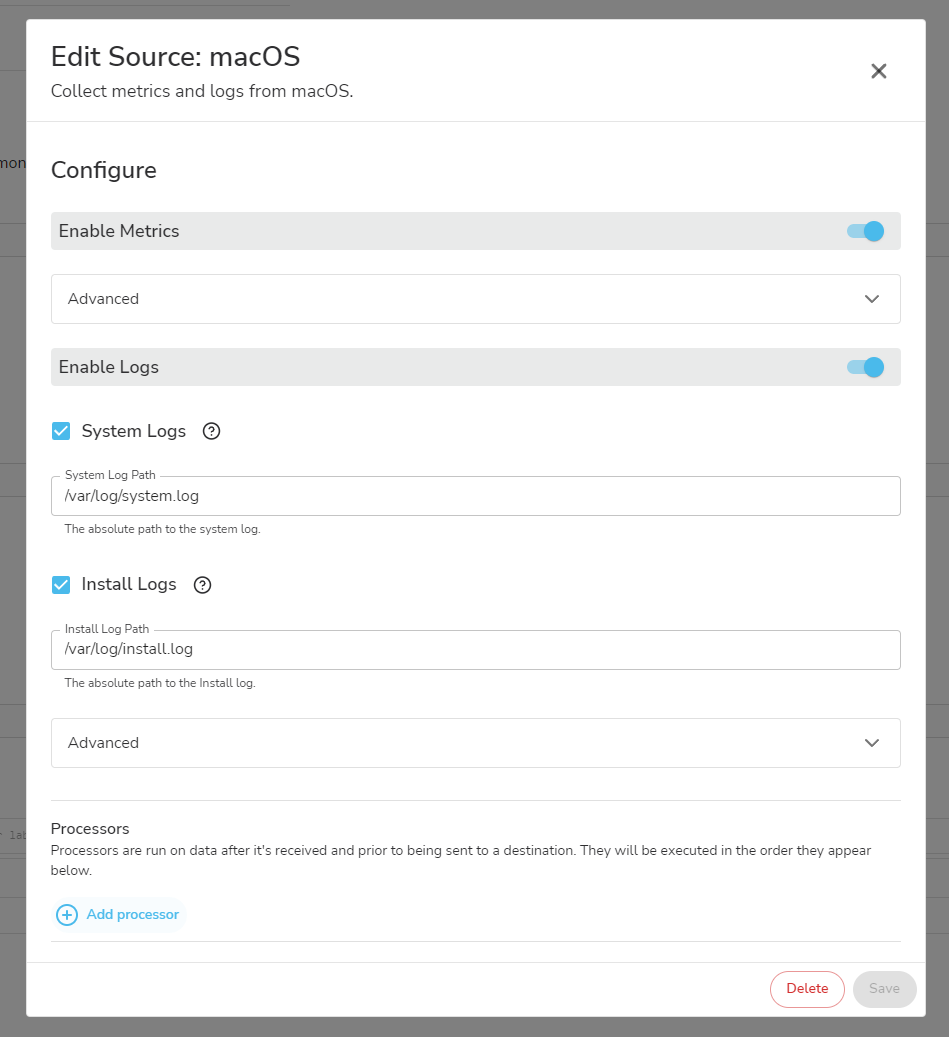
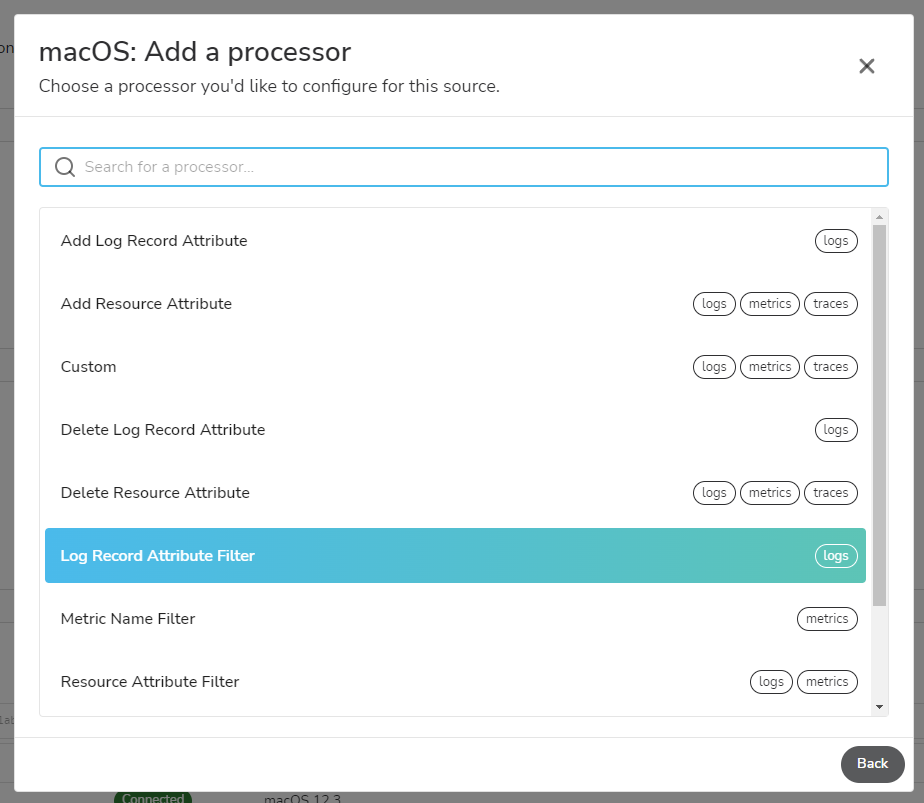
4. You will see many different processor types that can be added. Processors help enrich data and reduce it. We’re focused on filtering logs to reduce costs, so we’ll use the “Log Record Attribute Filter” processor.
5. Fill in the processor details using the drop downs and copying the information from Snapshot. The “Key” is any Attribute label that appears on the left when inspecting the log. The “Value” is anything that appears to the right of the Key when examining the log.
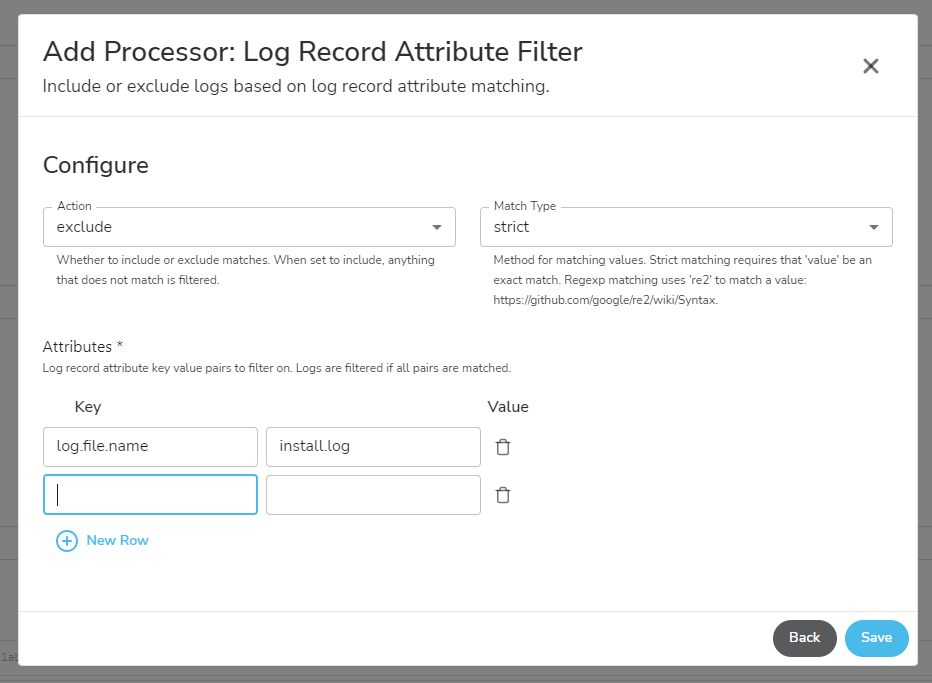
- You can add rows for as many filters as you want to run on the agent.
6. Click “Save”. Your agent will update automatically, and the designated logs will be filtered
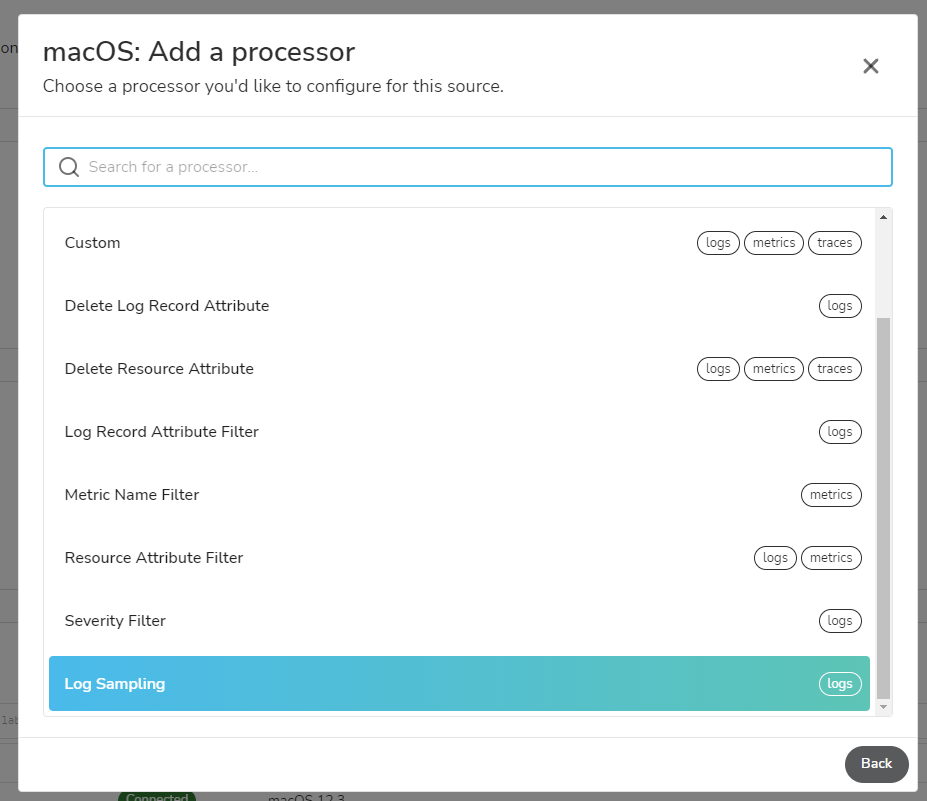
You can repeat that process using the “Metric Name Filter” processor and copy the metric name you want to exclude. Alternatively, if you're going to reduce the data flow but not filter any data completely, use the following steps:
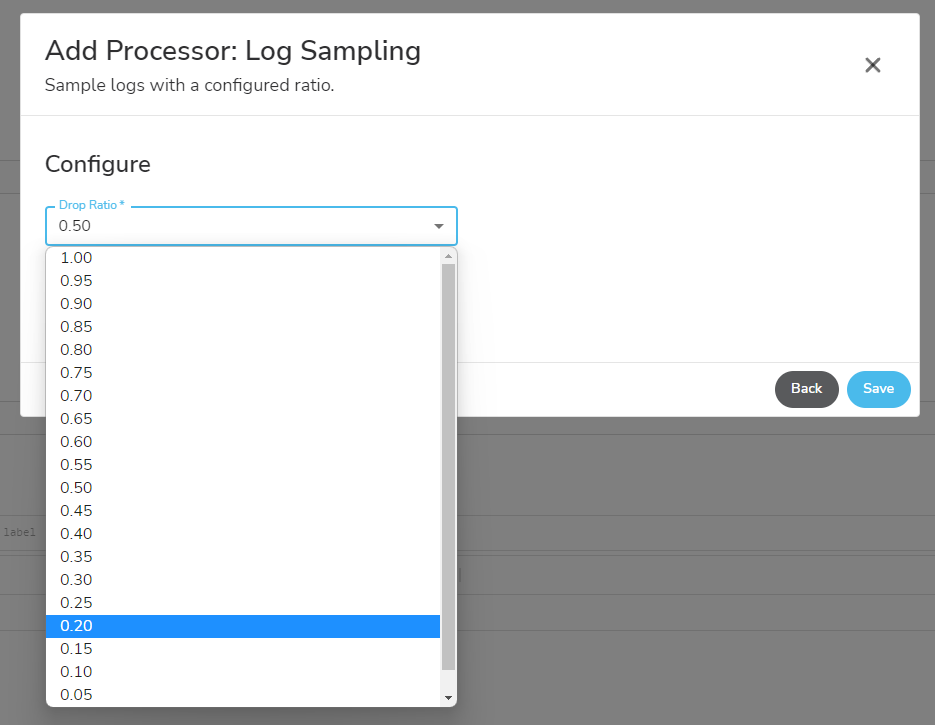
- Add a “Log Sampling” processor.
2. Select the ratio of logs you want the agent to sample and click “Save.”
Filtering metrics and sampling logs are excellent ways to reduce data costs while maximizing your data's value. BindPlane OP is the first data pipeline management tool that allows you to use OpenTelemetry on all sources with a smooth user interface to manage your entire data infrastructure in one place. To learn more about BindPlane OP, visit https://observiq.com/solutions/bindplane-op/ or chat directly in the BindPlane OP Community Slack.


