Integrating OpenTelemetry into a Fluentbit Environment using BindPlane OP

Fluentbit is a popular logs and metrics collector used for monitoring anything from virtual machines to containerized applications. With the rise of BindPlane OP and OpenTelemetry, it is not uncommon for organizations to begin replacing Fluentbit, or integrating OpenTelemetry with Fluentbit.
An organization may have hundreds or thousands of Fluentbit agents deployed to their endpoints but they want to manage the pipeline using BindPlane OP. These organizations have two choices:
- Replace their Fluentbit agents with OpenTelemetry collectors
- Integrate OpenTelemetry into their existing architecture
The second option is often desired as it allows the existing Fluentbit agents to remain in place, as they are already configured and working great. This blog will show how we can insert OpenTelemetry into the middle of the architecture using BindPlane OP.
Architecture
For the purpose of this blog, we will be using Google Compute Engine instances (GCE). The approach taken in this blog can be used with any backend supported by Fluentbit and OpenTelemetry, such as Elasticsearch or Grafana Loki. We will be using Google Cloud Logginghttps://cloud.google.com/logging.
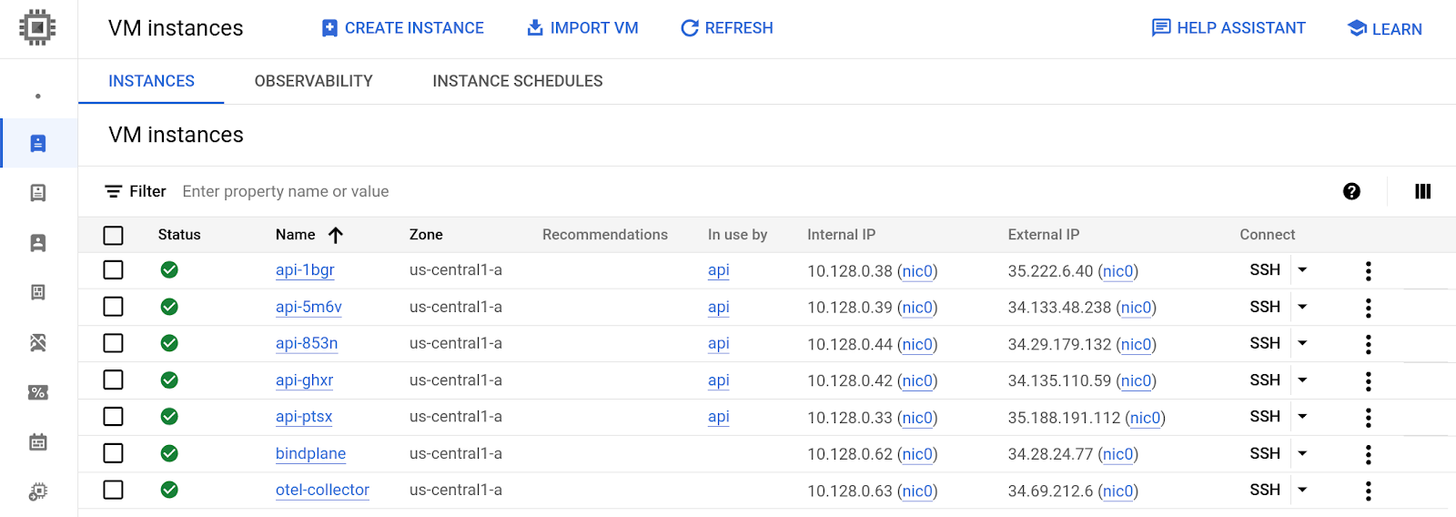
Deployed to our environment, we have the following GCE instances:
- “Api” example application and Fluentbit (x5)
- BindPlane OP server
- observIQ OTEL Collector managed by BindPlane (x1)
Fluentbit to Google Cloud (Stackdriver output)
Before implementing OpenTelemetry, Fluentbit is configured to send all logs straight to Google Cloud.
The Fluentbit configuration looks like this.
1# /etc/fluent-bit/fluent-bit.conf
2[SERVICE]
3   flush                 1
4   log_level             info
5   parsers_file parsers.conf
6
7
8[INPUT]
9   name  tail
10   path  /opt/logs/log.json
11   tag api
12
13
14[FILTER]
15   Name parser
16   Match api
17   Key_Name log
18   Parser json
19
20
21[FILTER]
22   Name record_modifier
23   Match *
24   Record hostname ${HOSTNAME}
25
26
27[OUTPUT]
28 Name stackdriverThe sample application log is being read at “/opt/logs/log.json”. A “record_modifier” filter is used to add the system’s hostname to the log record. This will allow you to filter logs based on hostname.
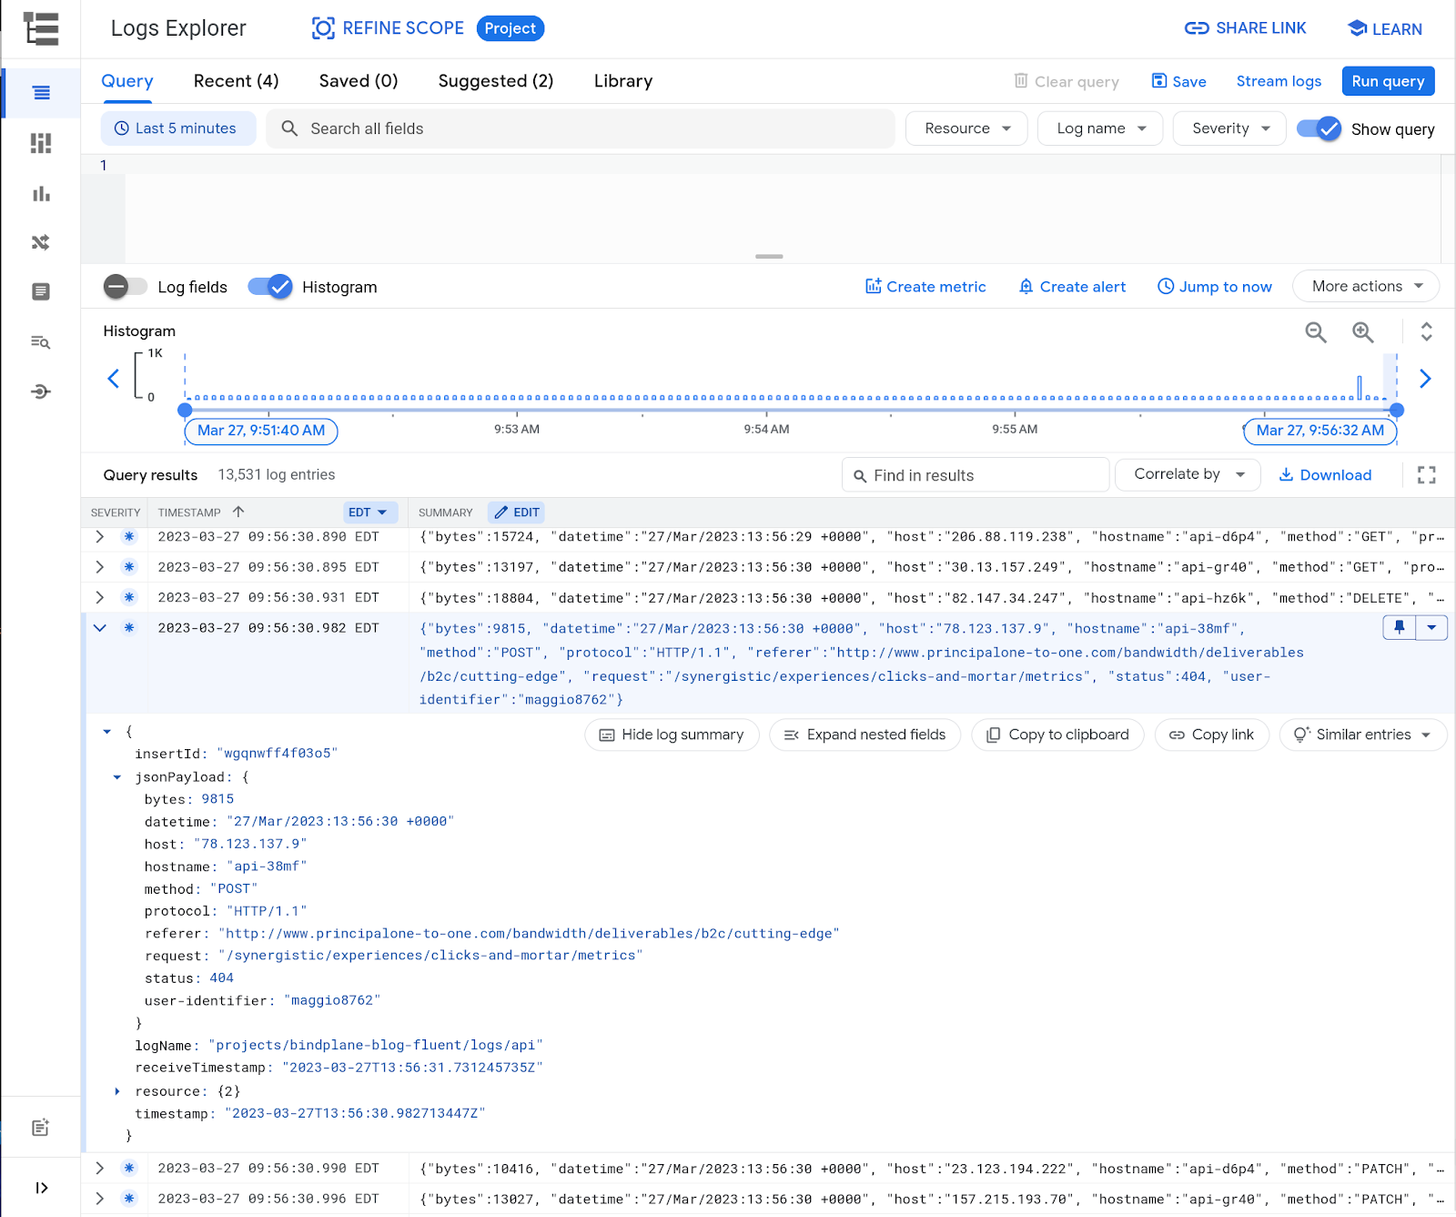
The logs can be viewed in Cloud Logging and will look like this
BindPlane Configuration
Now that Fluentbit is sending logs to Google Cloud, we can move on to configuring BindPlane OP and its managed observIQ OTEL collector. Once configured, we will reconfigure Fluentbit to forward to the OpenTelemetry collector instead of sending logs to Google directly.
This blog does not cover BindPlane’s installation. BindPlane OP’s installation documentation can be found here.
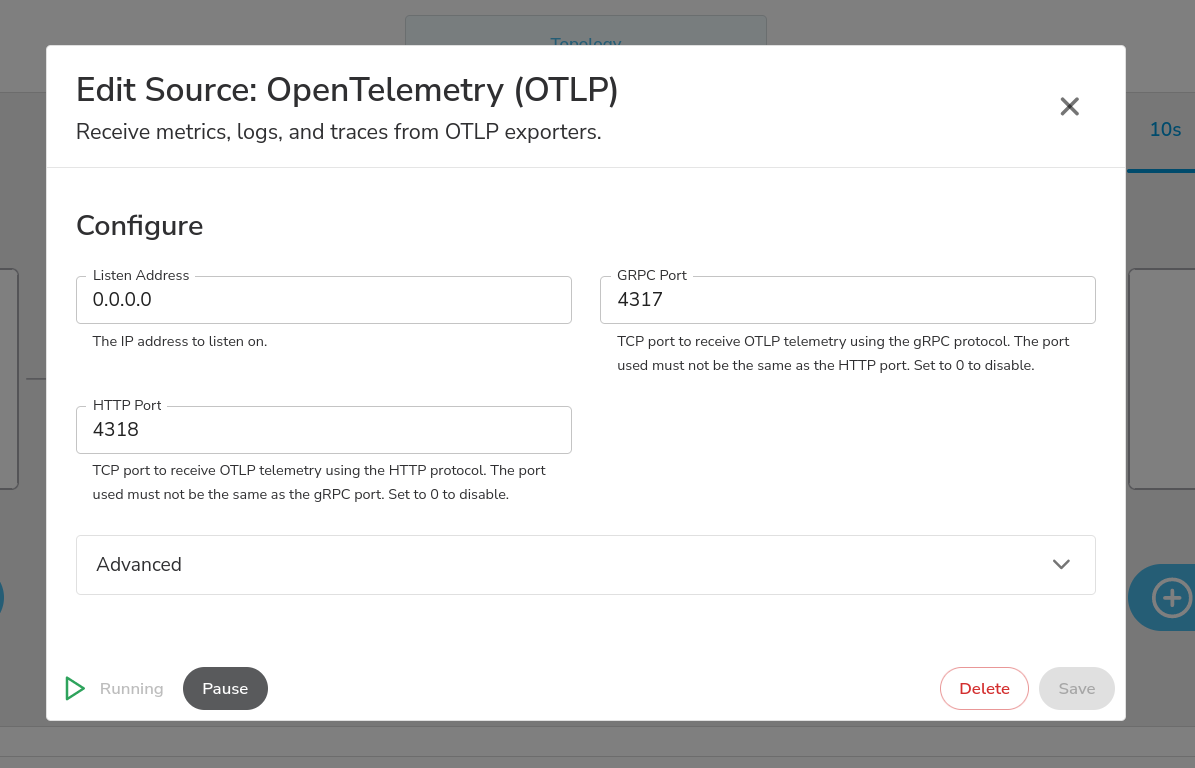
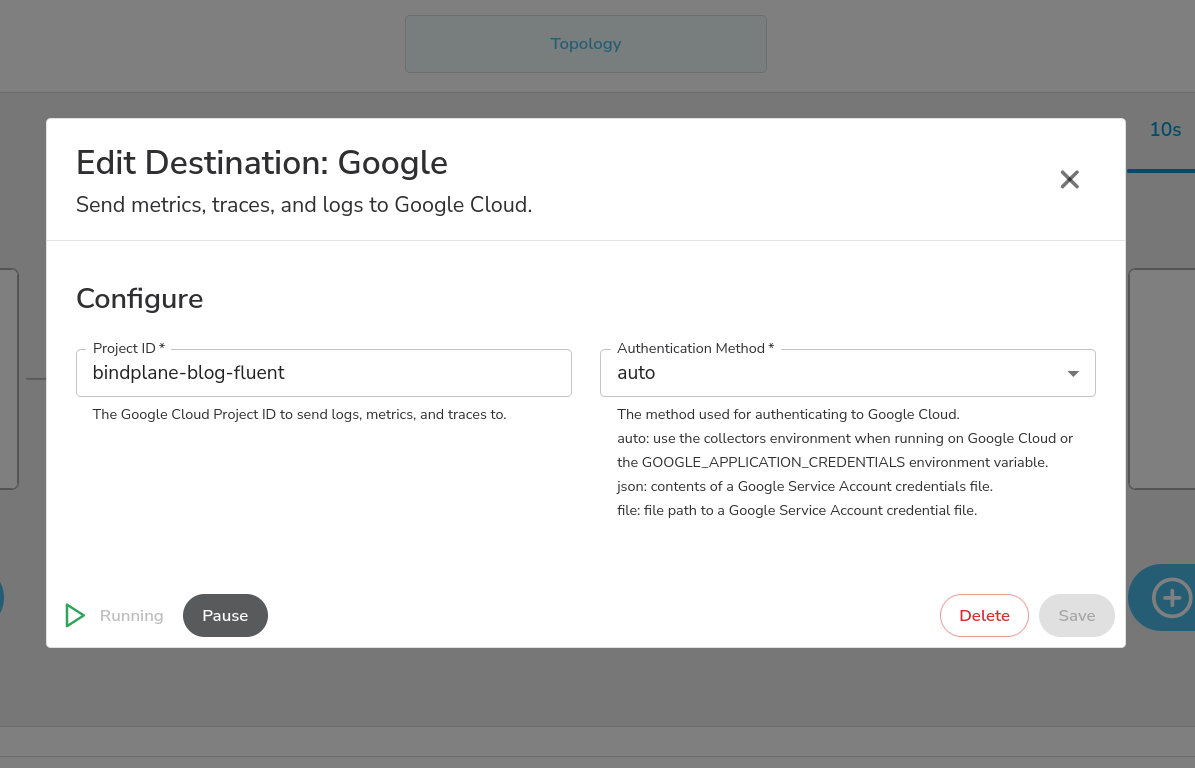
Within BindPlane, create a new configuration with the OpenTelemetry source and the Google Cloud destination. Because we are running on GCE, default options for the OTLP source and Google destination will be sufficient.
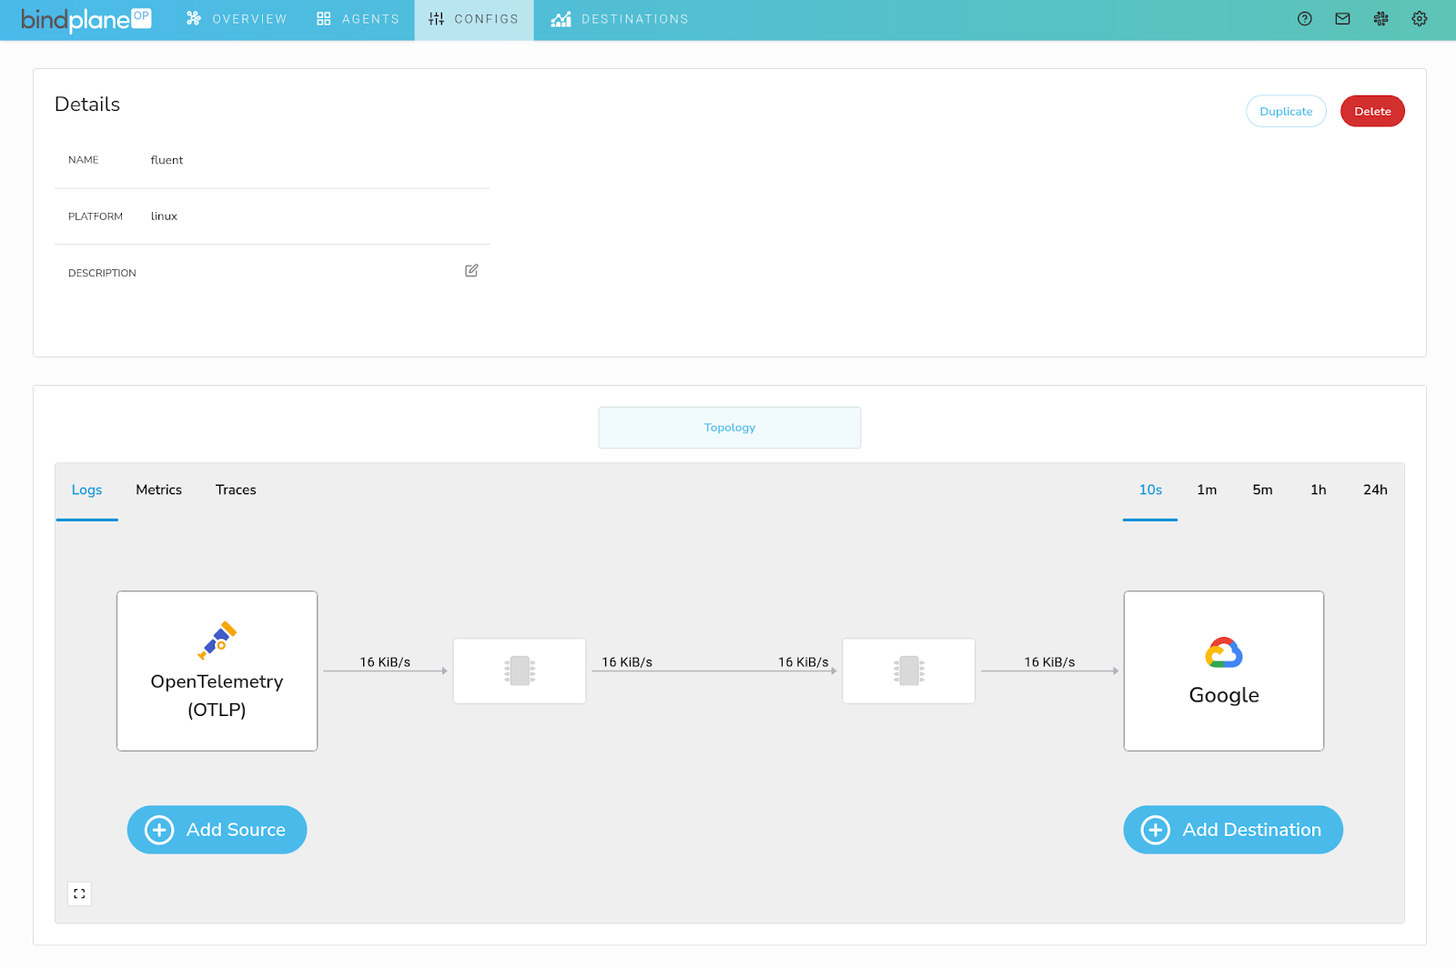
OpenTelemetry Collector Configuration
On the Agents page, click on “Install Agents”. Select your platform and configuration. Copy the install command to the collector system.
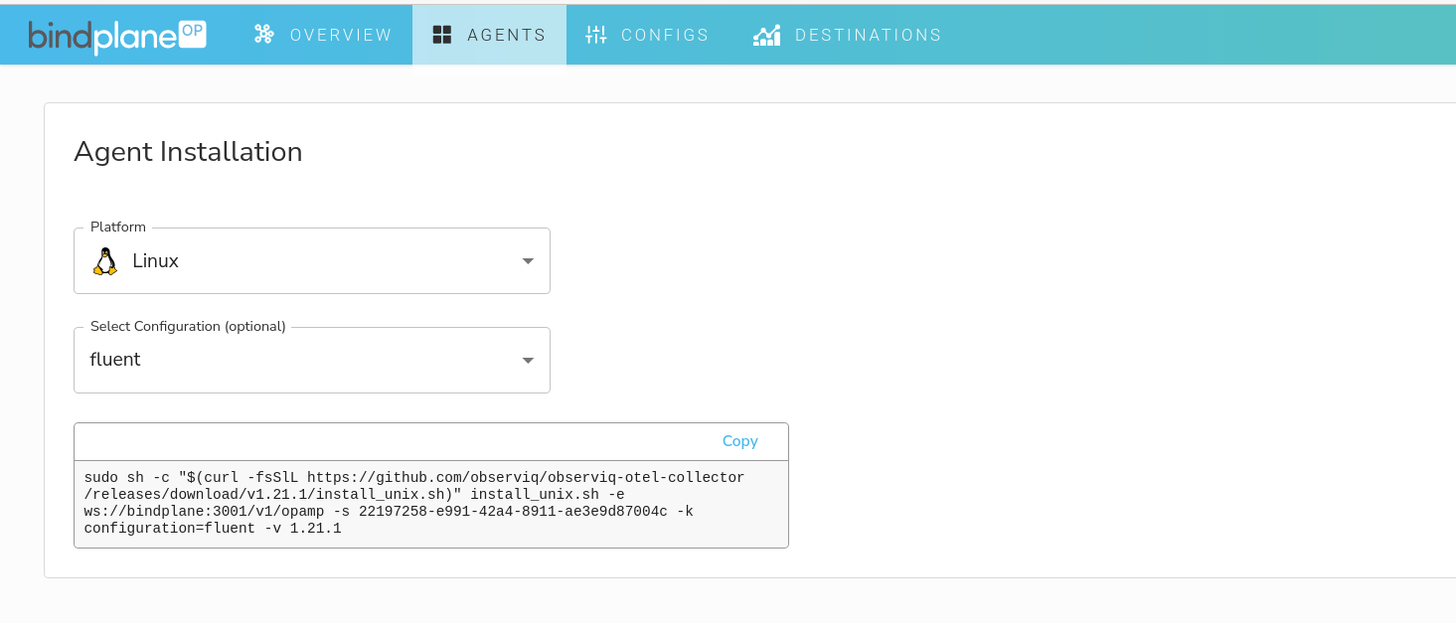
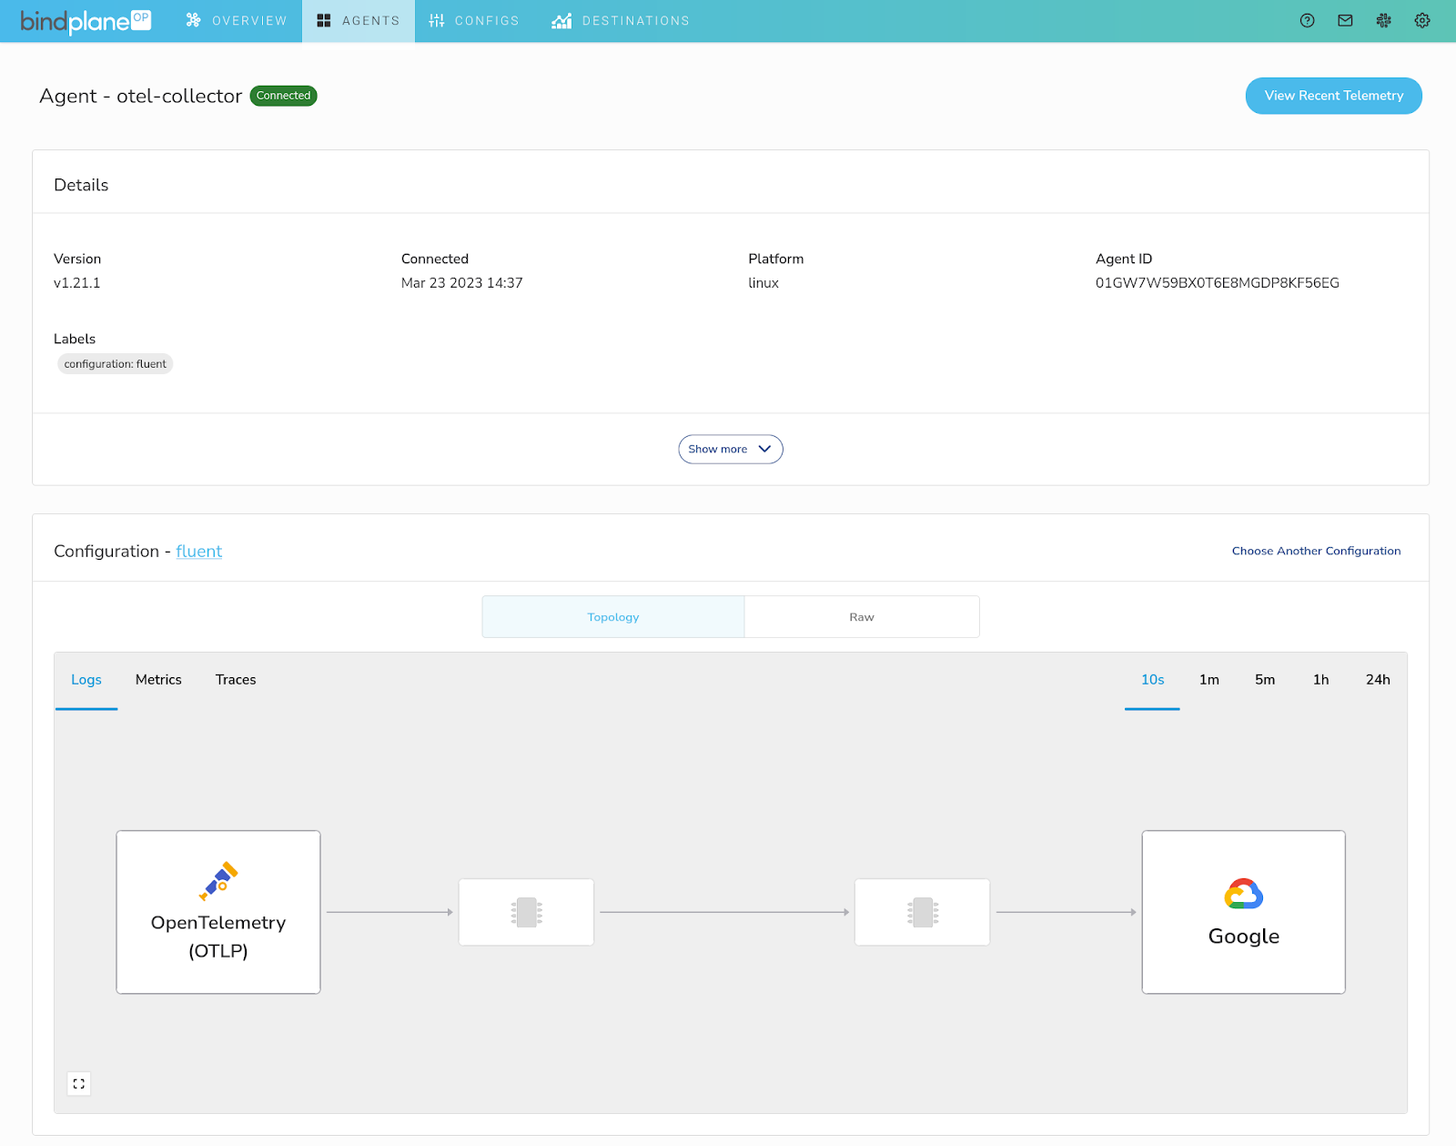
Once installed, the agent will appear with the configuration attached.
Fluentbit to OpenTelemetry
With BindPlane OP and a managed agent configured, we can move onto updating Fluentbit to forward to the OpenTelemetry collector instead of sending logs directly to Google.
Modify the configuration to use the OpenTelemety output instead of Stackdriver. The new configuration looks like this:
1# /etc/fluent-bit/fluent-bit.conf
2[SERVICE]
3   flush                 1
4   log_level             info
5   parsers_file parsers.conf
6
7
8[INPUT]
9   name  tail
10   path  /opt/logs/log.json
11   tag api
12
13
14[FILTER]
15   Name parser
16   Match api
17   Key_Name log
18   Parser json
19
20
21[FILTER]
22   Name record_modifier
23   Match *
24   Record hostname ${HOSTNAME}
25
26
27[OUTPUT]
28   Name                 opentelemetry
29   Match                *
30   Host                 otel-collector
31   Port                 4318
32   Log_response_payload True
33 Tls OffNote that the Host option must point to a resolvable hostname or an IP address. The port is `4318` which matches the OTLP HTTP port configured in the BindPlane configuration’s OTLP source.
Once configured, restart all Fluentbit collector processes. You will notice that the configuration’s measurements will begin showing up. We can see the throughput at all stages of the pipeline.
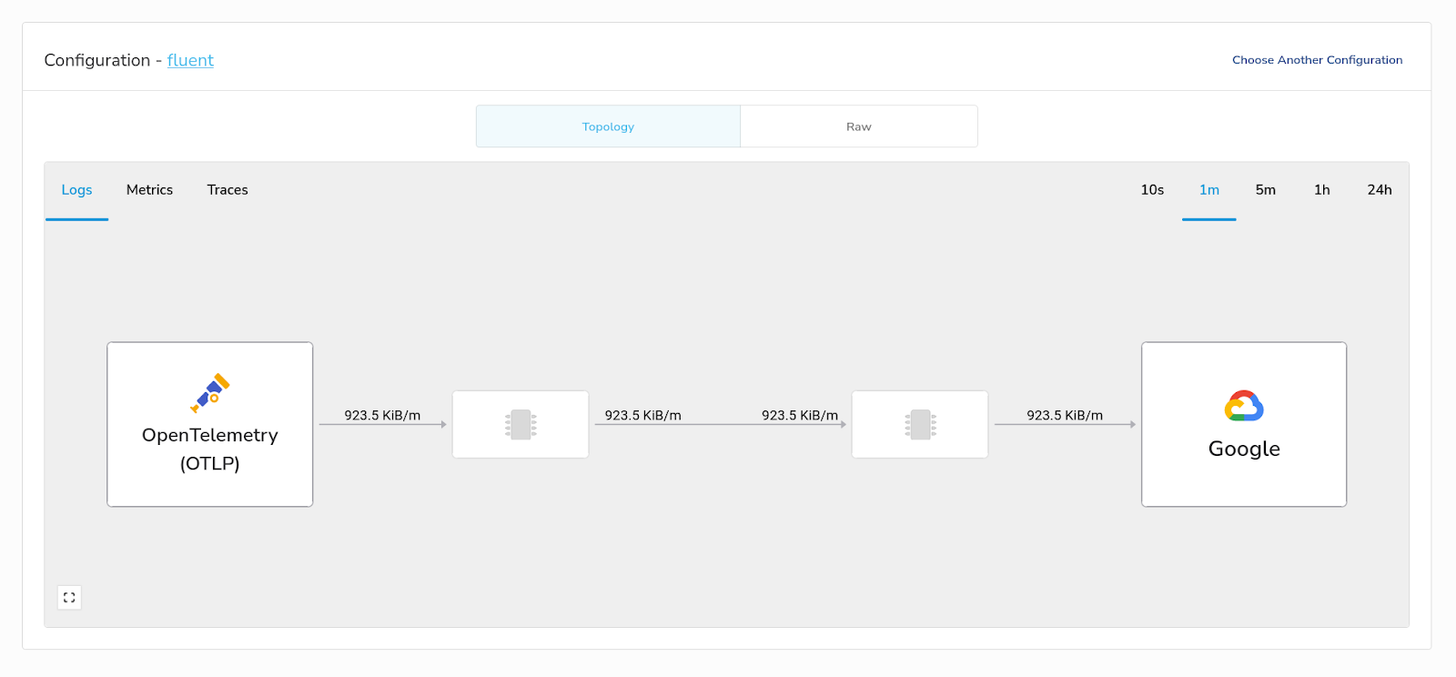
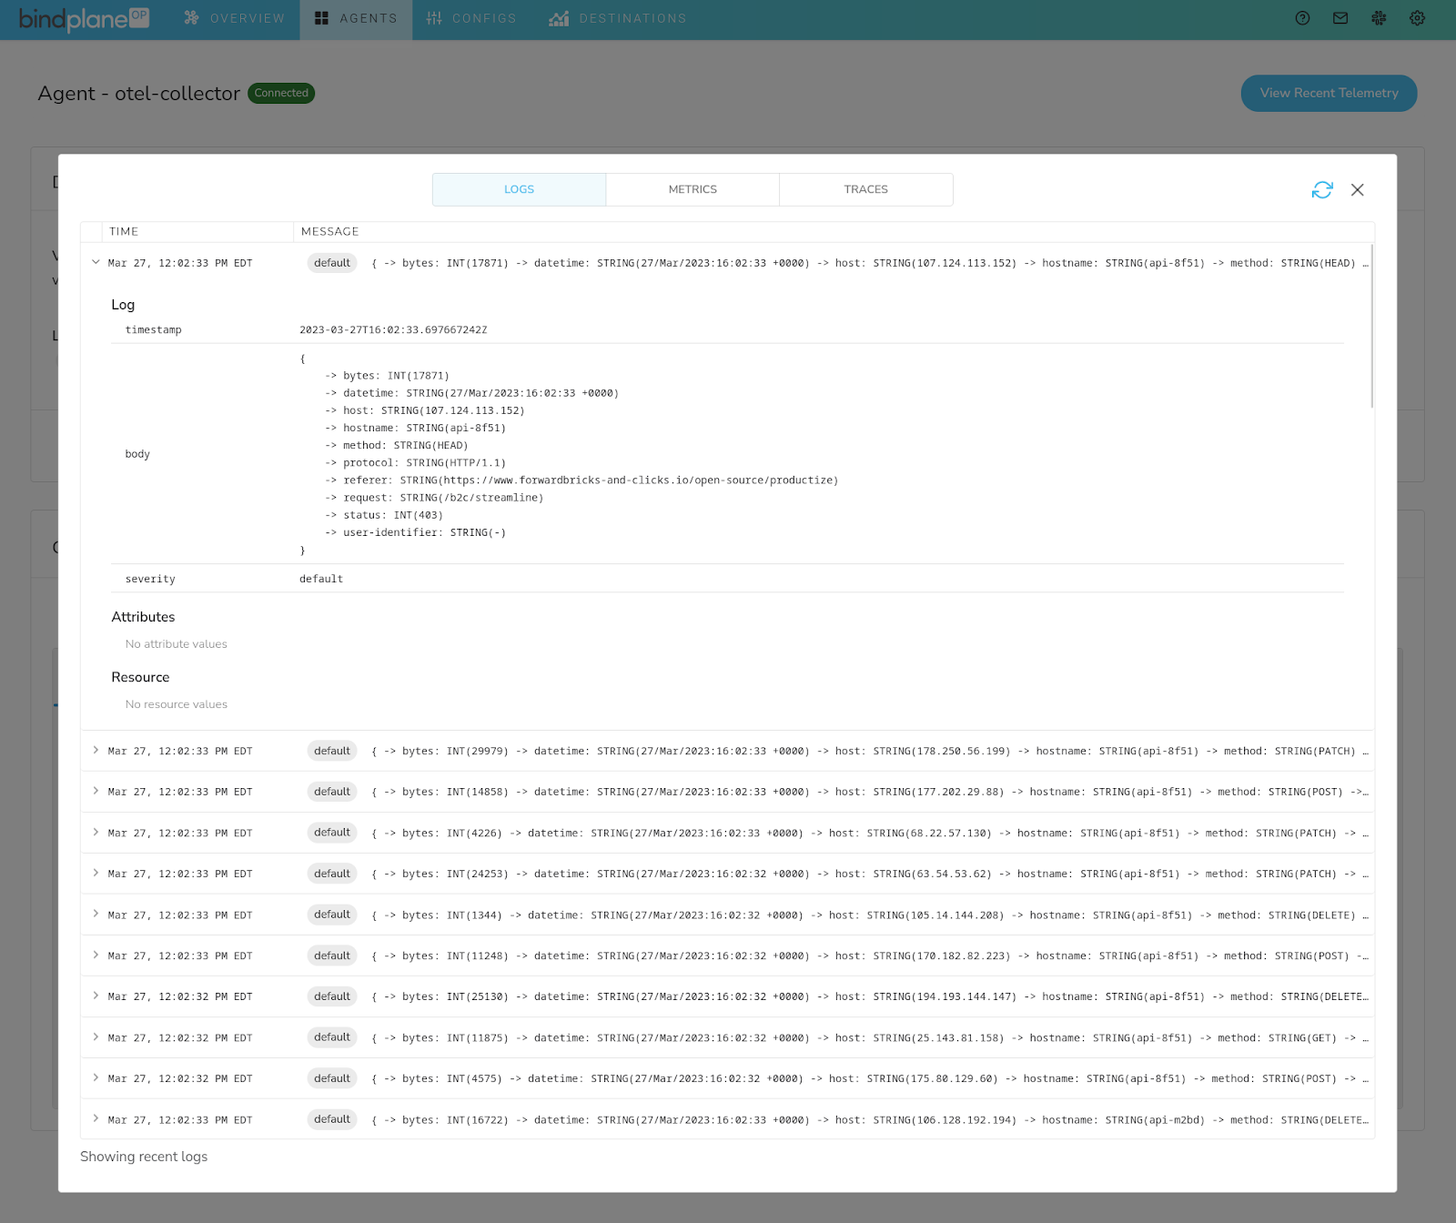
In addition to throughput measurements, you can confirm that logs are flowing to the collector by using the Recent Telemetry feature, available on the agent’s page.
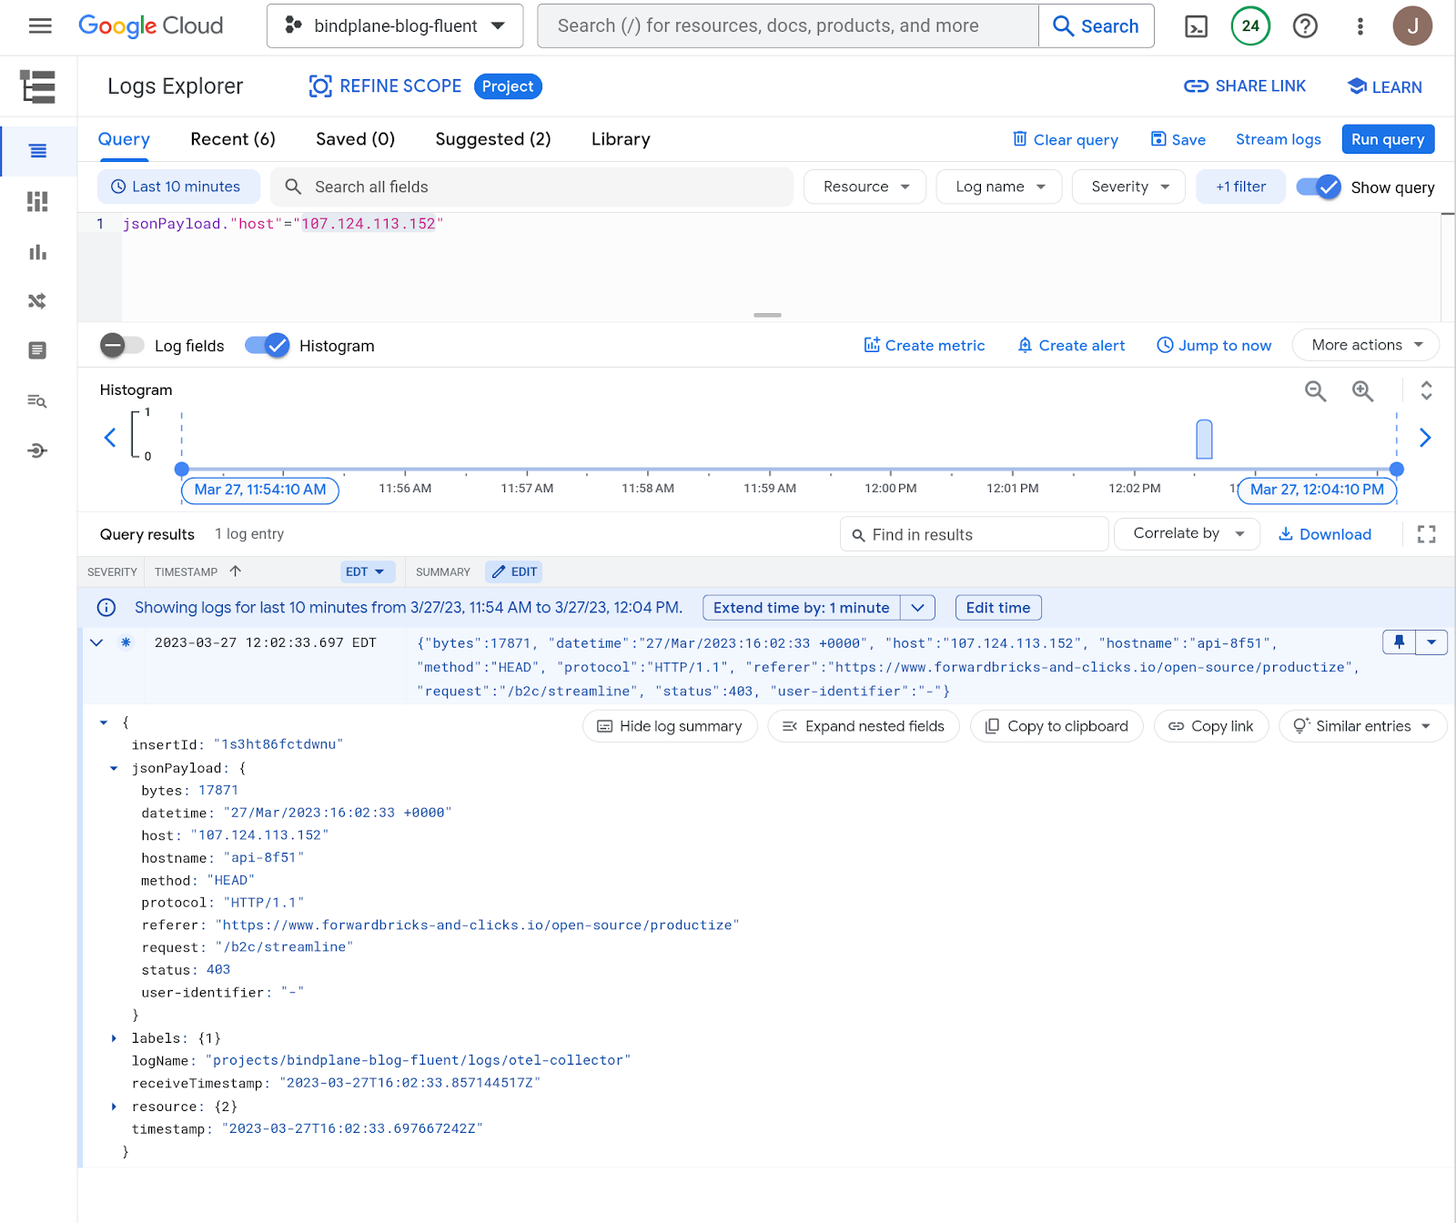
The same log can be viewed in Google Cloud:
But There’s More
Now that logs are flowing from Fluentbit to a BindPlane managed collector, we can immediately see value with the following features:
- Pipeline throughput measurements
- Agent snapshots
- Pausing Telemetry
- Enrich logs using processors
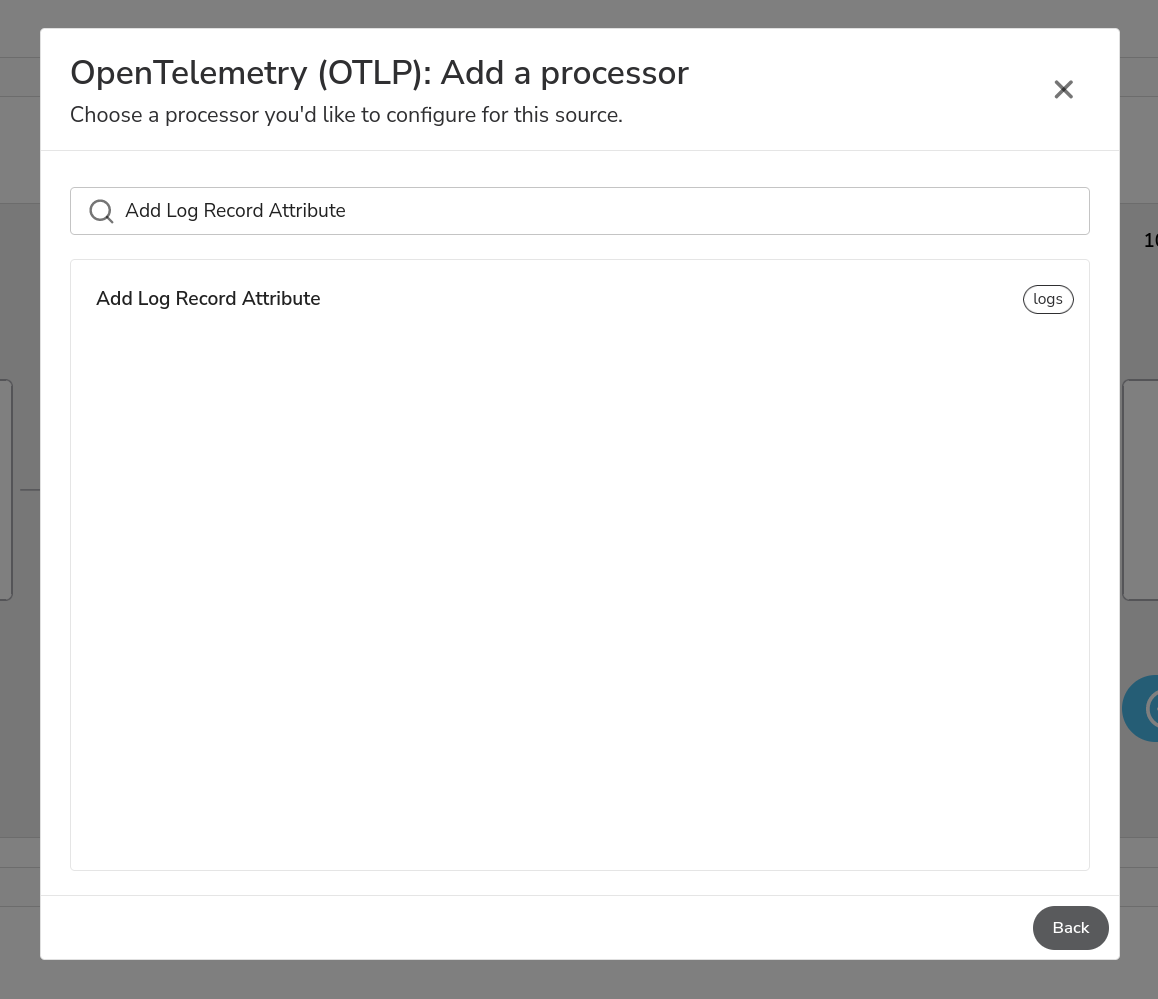
Commonly, users will want to add metadata in order to enrich their logs. BindPlane can easily solve this using processors. We can add Log Record Attributes to the logs using the Add Log Record Attribute processor.
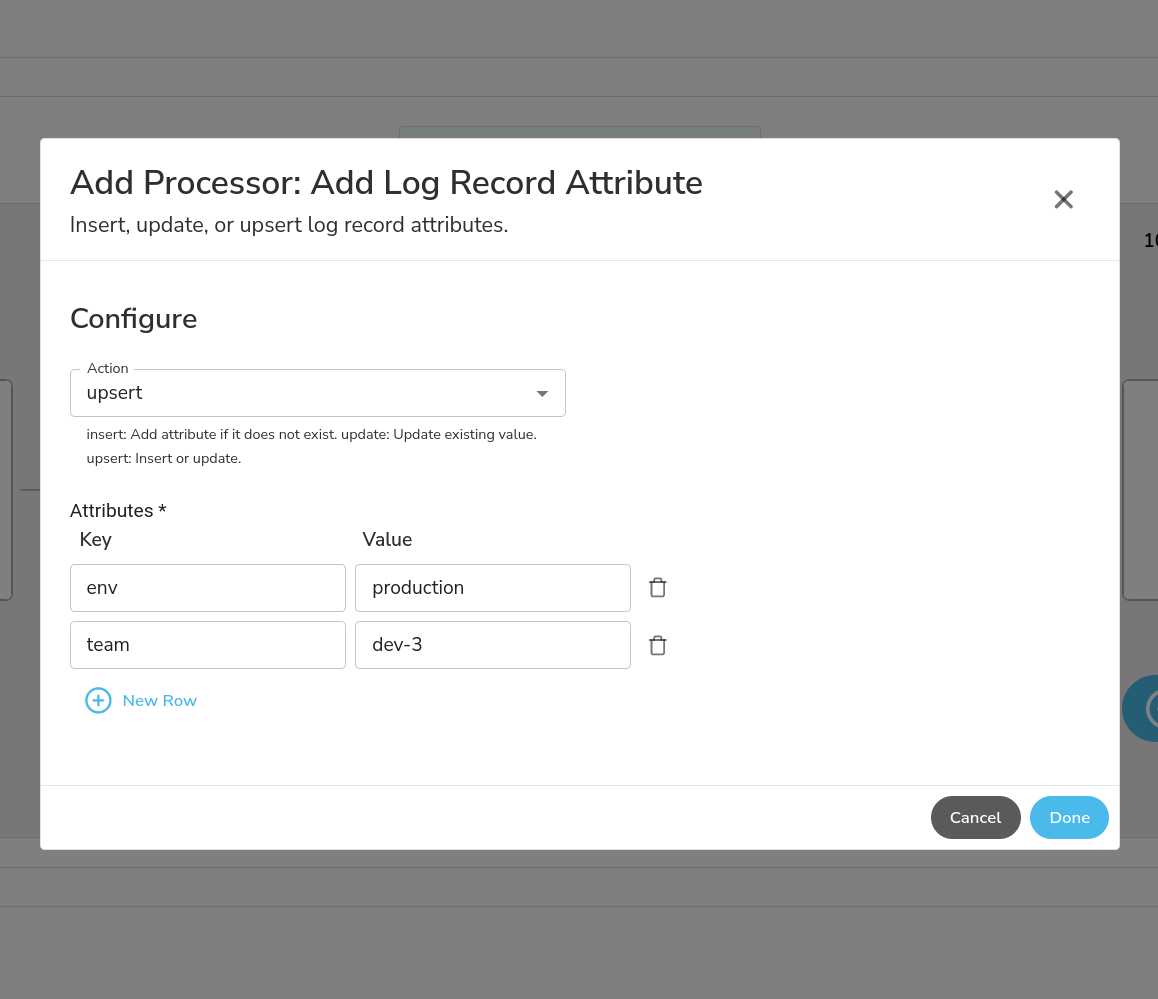
Once saved, the agent’s recent telemetry snapshot will show additional attributes being added to each log record.
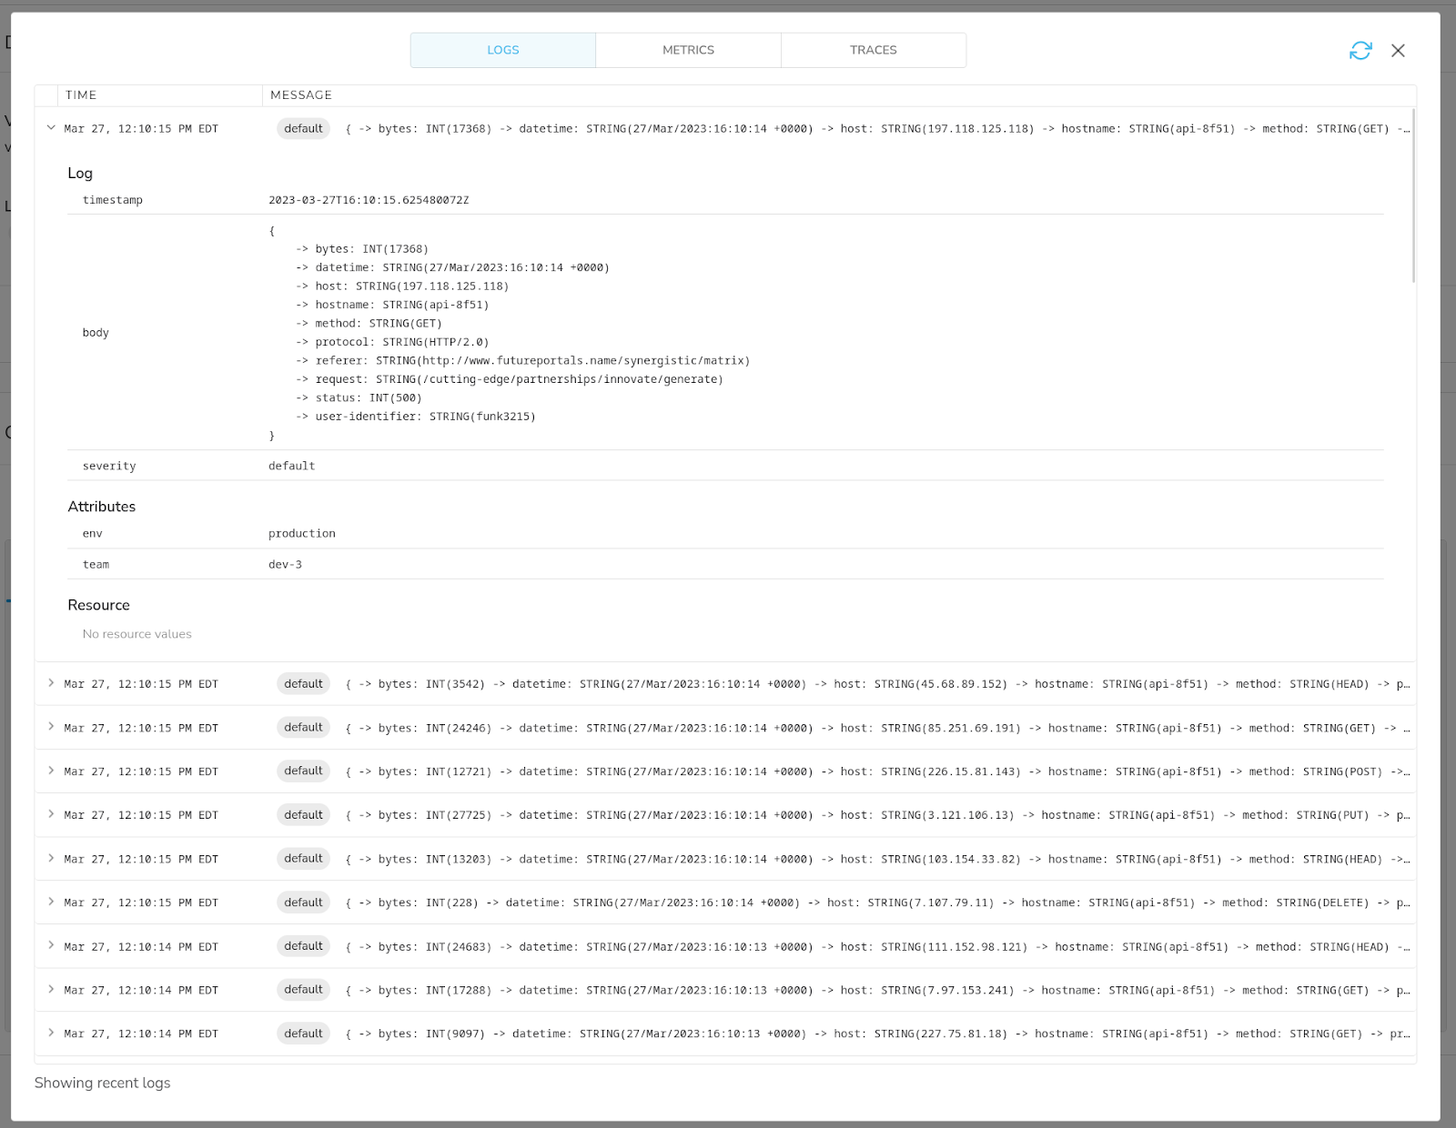
Adding log record attributes is one of many ways BindPlane OP can be used to enhance your telemetry.
Additional Thoughts / Next Steps
Redundancy
In production, it is recommended to utilize multiple agents when using the OTLP source type. These agents can be load balanced to distribute load and provide redundancy. When using a load balancer, the Fluentbit OpenTelemetry output should point to the loadbalancer’s IP address instead of an individual agent.
Replacing Fluentbit
The architecture shown in this blog proves that Fluentbit and OpenTelemetry can live seamlessly in the same environment. It is not necessary to replace Fluentbit when moving to OpenTelemetry and BindPlane.
Users at large organizations can adopt OpenTelemetry by installing BindPlane managed OpenTelemetry agents on new systems, while keeping the old Fluentbit agents in place. This allows OpenTelemetry adoption to happen without requiring large changes to existing infrastructure.
To learn more, visit our docs https://docs.bindplane.observiq.com/docs or ask questions directly by joining our bindplane slack community.


