Turning Logs into Metrics with OpenTelemetry and BindPlane OP
Turning logs into metrics isn’t a new concept. A version of this functionality is implemented in most agents, visualization tools, and backends. It’s everywhere because converting logs to metrics has many practical applications and is one of the fundamental mechanisms for controlling log volume in a telemetry pipeline.
In this post, I’ll briefly overview log-based metrics, explain why they matter, and provide examples of how to build them using OpenTelemetry and BindPlane OP.
What is a Log-Based Metric?
As its name implies, a log-based metric ('LBM') is a custom metric derived from log data. LBMs are created by extracting key bits of information from a log, aggregating those bits with an operator (average, count, sum, etc.), and outputting the result as a time-series metric.
Why Log-Based Metrics are Important
Use Cases for Log-Based Metrics
Log-based metrics satisfy a wide range of use cases for SREs, DevOps, Product, and Compliance teams, such as:
- Observing an application or system by supplying one or all of the 4 Golden Signals not natively exposed by the application or system.
- Monitoring anomalous security behavior by mathing (definitely a word, trust me) charting logon activity and access requests.
- Monitoring compliance standards, where logs are often the only available signal to work with.
- Real User Monitoring (RUM): tracking sign-ups, onboarding friction, in-app user behavior, and usage trends.
- Data Reduction: shrinking large volumes of log data into bite-sized, concentrated metrics.
Benefits of Log-Based Metrics
Implementing log-based metrics in your pipeline can have several lasting benefits:
- Significantly Reduces Costs: Firsthand, we’ve witnessed log volume and licensing costs reduced by up to 80% for specific applications after implementing LBMs.
- Reduces Stress on Infrastructure: implementing log-based metrics minimizes the load on your network and hosts, as the size of the data is significantly reduced
- Facilitates vendor-neutrality: When created outside your observability backend, LBMs can be carried forward to new platforms as your organization's needs change.
Where should log-based metrics be implemented?
Observability/SIEM backends
Some observability/SIEM backends incorporate this functionality, processing the data after it’s delivered via ingestion API. However, this approach can come with extra costs, some of which are hidden.
Creating log-based metrics in-platform means your team spends more time and effort customizing proprietary software, which biases your telemetry pipeline toward a specific vendor.
Consequently, the customizations must be recreated if the budget or feature set dictates a migration to a new backend.
Telemetry Pipeline (recommended)
Conversely, by creating log-based metrics within an OpenTelemetry-backed telemetry pipeline, users can process log-based metrics closer to the edge of their pipeline, making it easier to carry the time and effort forward.
Creating Log-Based Metrics with OpenTelemetry: 2 Methods
Now, let’s dive in further. There are 2 methods to be aware of when building log-based metrics in OpenTelemetry-- each leveraging a different core component.
Method 1: Building Log-Based Metrics with Connectors
Summary and Breakdown
A Connector is a relatively new component of the OTel collector that bridges metric, log, and trace pipelines. This flexibility enables the creation of LBMs with minimal OTel components and configuration.
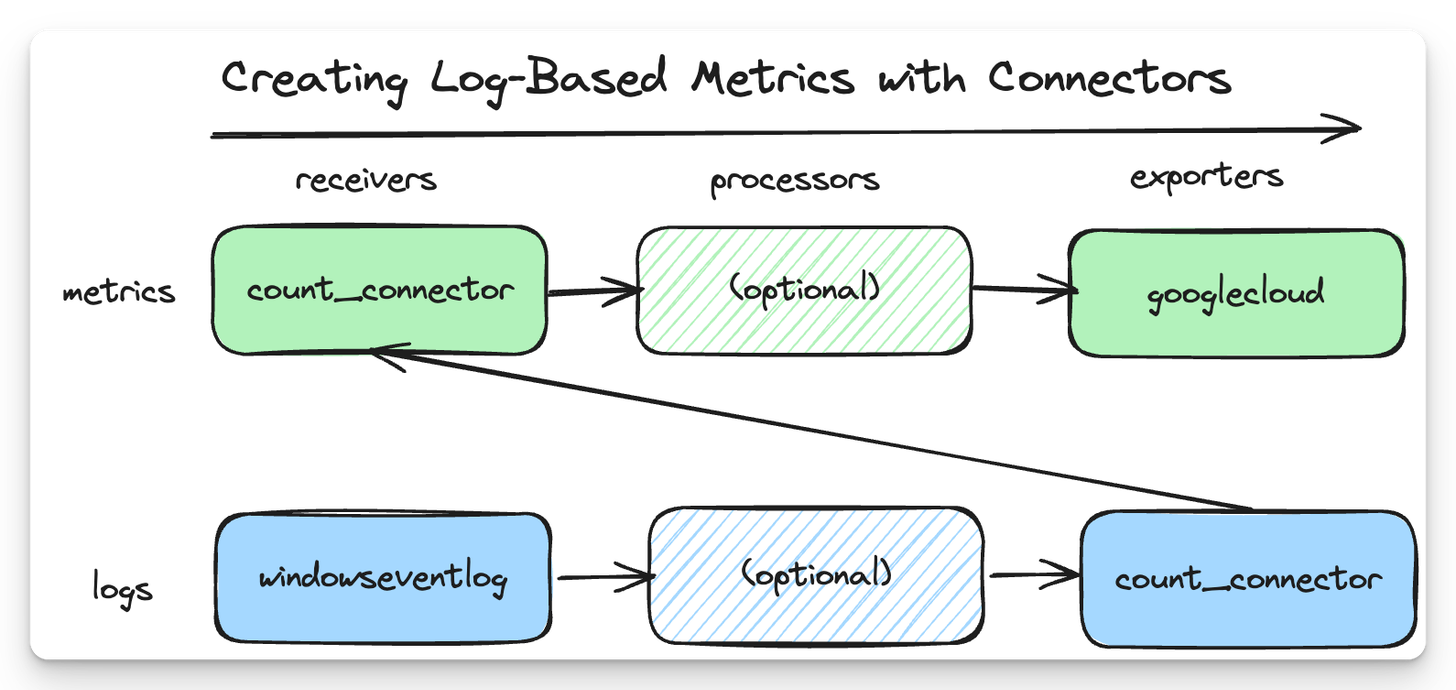
In this example, we’re collecting Windows events with the windowseventlog receiver and using the count_connector to count login attempts and construct our log-based metric.
Within the collector's config.yaml, the count_connector is defined as both an exporter in the logs pipeline and a receiver in the metrics pipeline, establishing the bridge between the two. This creates a pathway for the LBM to move through the metric pipeline and on to Google Cloud for analysis.
Sample OTel Collector Configuration
For more context, here’s a sample OTel config.yaml that maps to the diagram above.
In this config, we’ve named the log-based metric windows_event.count and have moved the log's event_id to an attribute which appears as a metric label in Google Cloud Operations.
1receivers:
2  windowseventlog:
3    channel: security
4    operators:
5  	  - type: move
6          from: body["event_id"]["id"]
7          to: attributes["event_id"]
8exporters:
9  googlecloud:
10connectors:
11  count:
12    logs:
13      windows_event.count:
14        description: "Windows Event count by Event ID"
15        attributes:
16          - key: event_id
17service:
18  pipelines:
19    metrics:
20      receivers: [count]
21      exporters: [googlecloud]
22    logs:
23      receivers: [windowseventlog]
24 exporters: [count]Ideal, But Not Recommended (Yet)
Connectors will soon be the recommended approach to building log-based metrics. Today, however, there’s a functionality gap. Specific operations (like counting) require a corresponding connector; the connector library isn’t comprehensive enough to cover the most common use cases, but I expect it to expand steadily in 2024.
As a quick aside, if you’re interested in learning more about Connectors, Dan Jaglowski gave an excellent talk at Kubecon EU ‘23 - I highly recommend it.
Method 2: Building Log-Based Metrics with OTel Processors + BindPlane (Recommended)
Summary and Breakdown
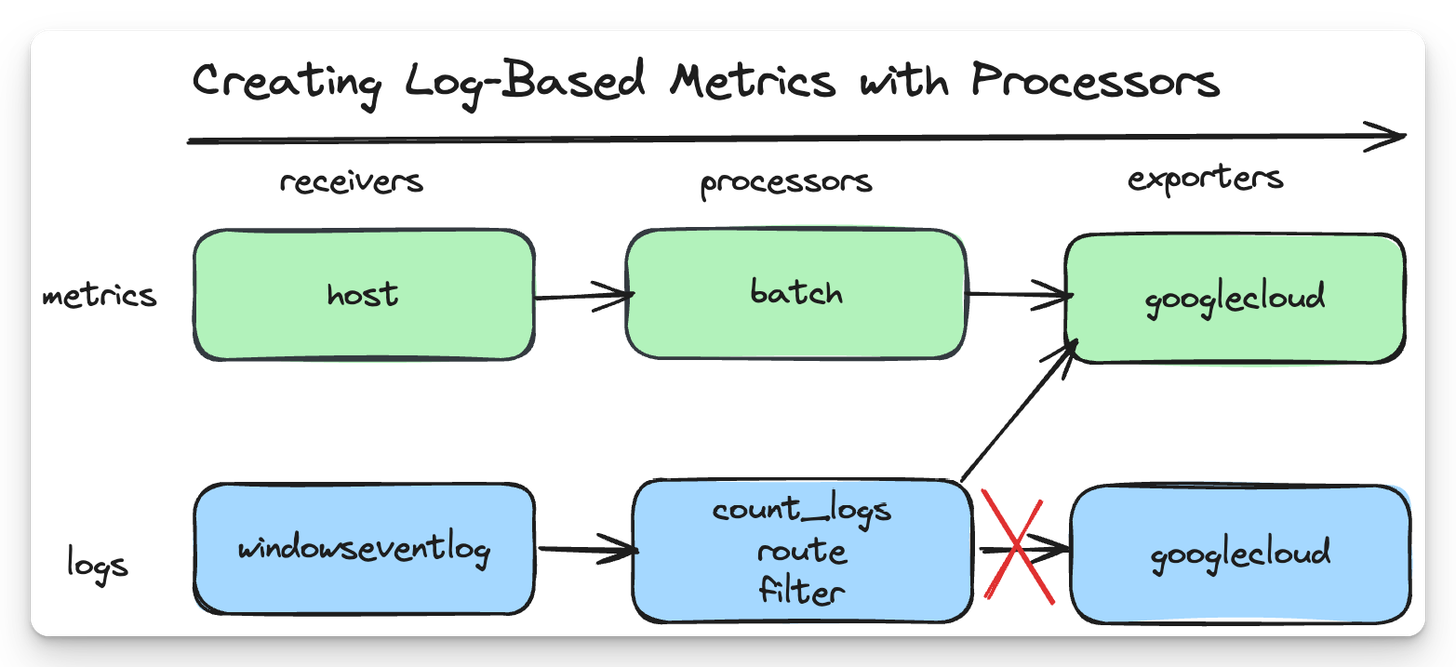
The second method involves using processors to construct a log-based metric. The count_logs processor can be used to count occurrences of specific log events, but creating a log-based metric also requires stringing together several other processors:
moveprocessor: to move some valuable bits in the body of a message to an attributerouteprocessor: to route the LBM to the metric pipeline's exporterfilterprocessor: to drop Windows Events before they’re passed along to thegooglecloudexporter
Recommended, but with added complexity
This method has proven very effective and is what we currently recommend to our customers.
If you’re new to OTel, chaining three or more processors together may seem overly complicated for the outcome we’re trying to achieve—I certainly empathize.
If you create your OTel collector configuration with BindPlane OP, nearly all complexity can be avoided.
Creating Log-Based Metrics with BindPlane OP
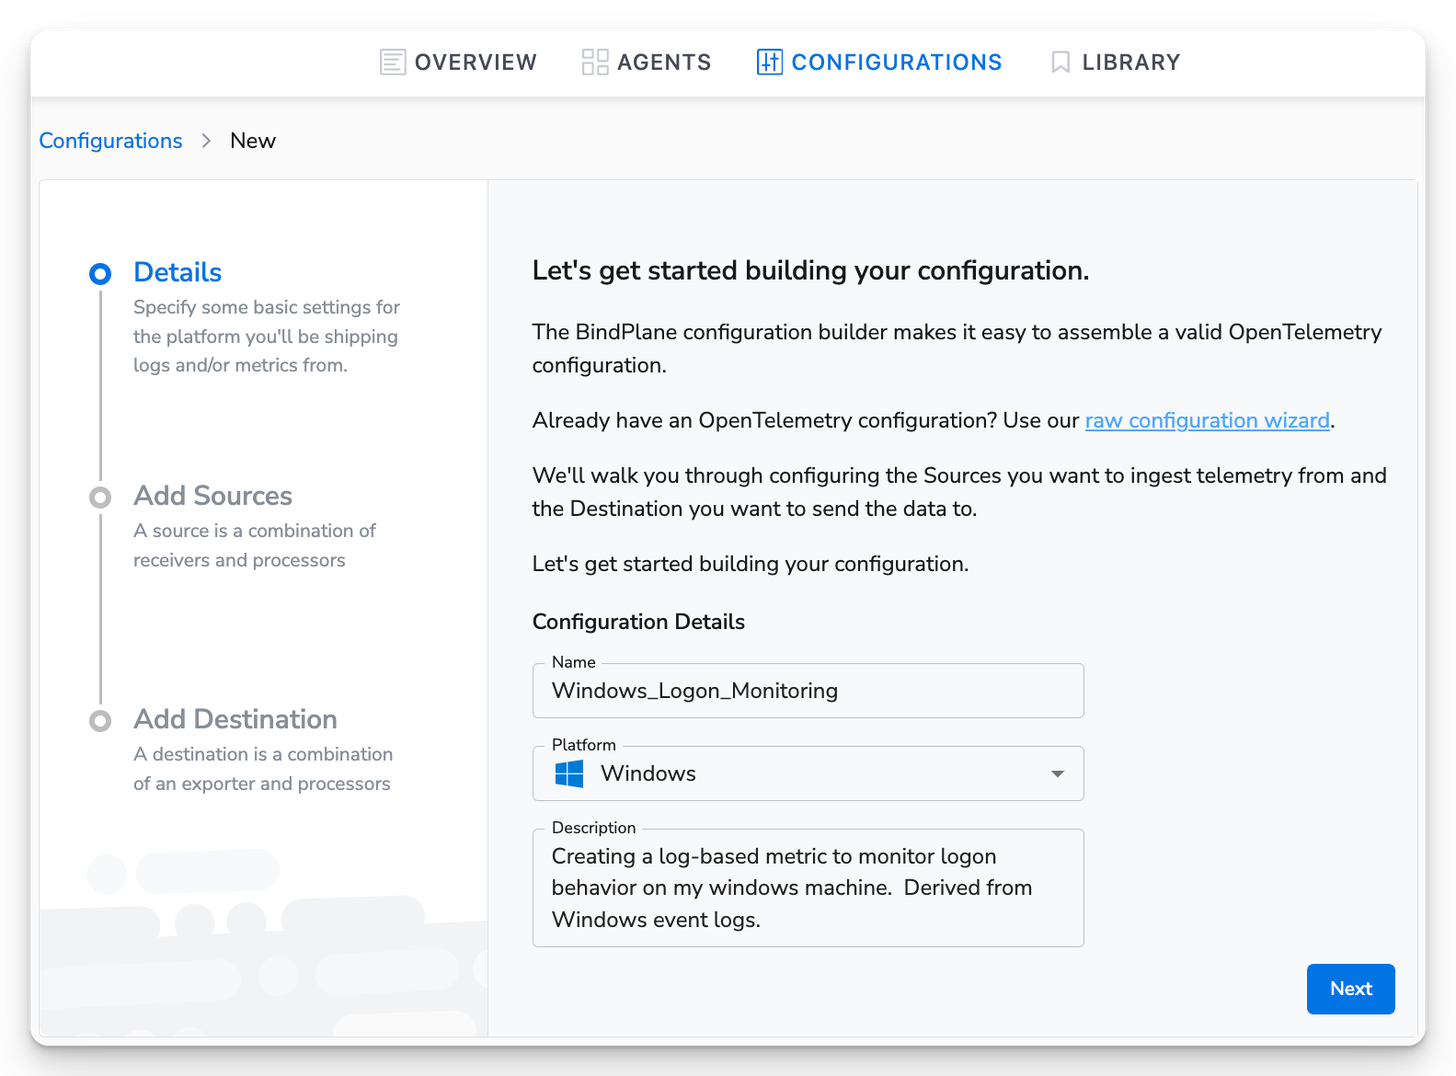
From BindPlane OP’s configuration builder, we can create log-based metrics with the help of a wizard and simplified UI.
Create an OTel configuration
First, we need to create our configuration:
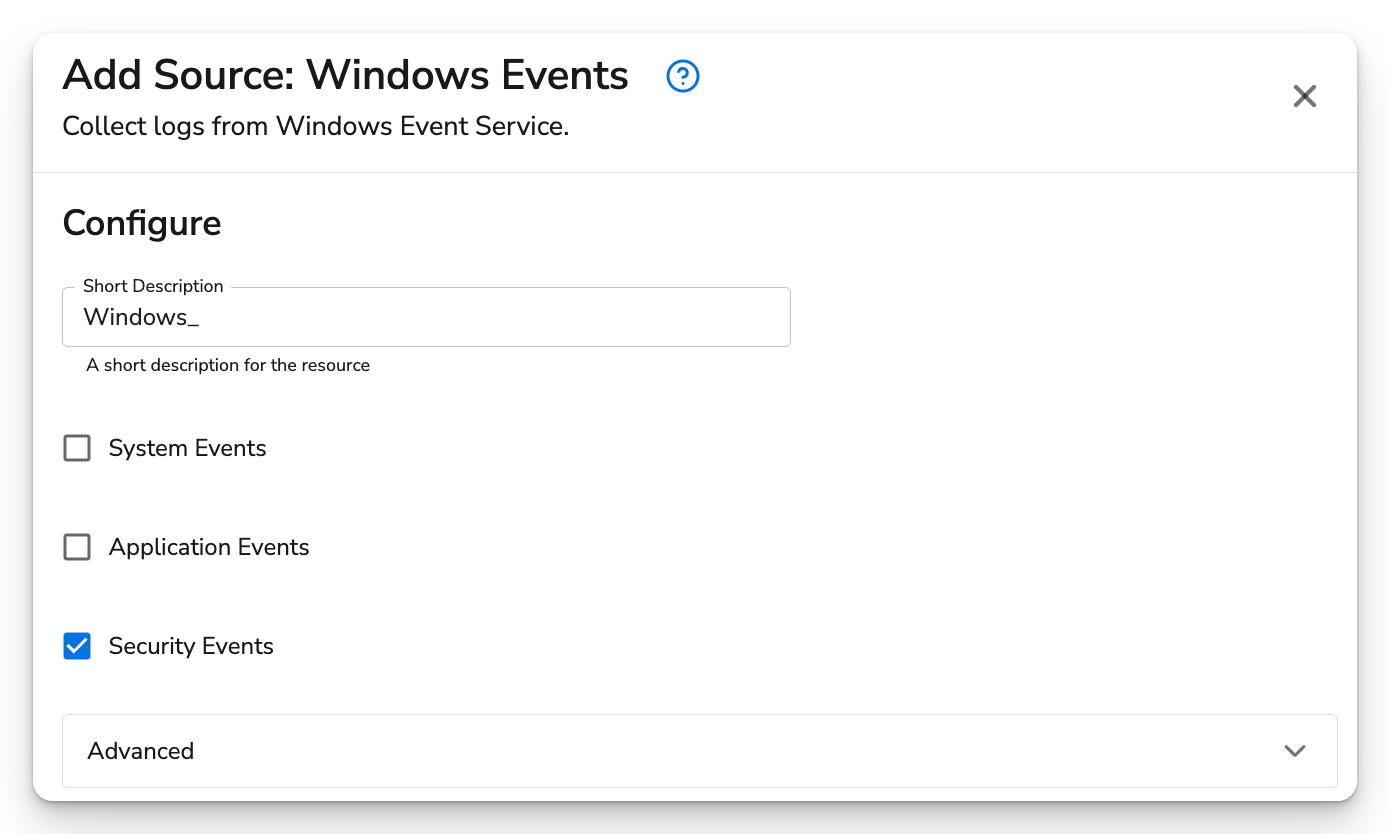
Next, add a Windows Events Source to your configuration. For this example, we only need to collect events from the Security channel, which captures login activity.
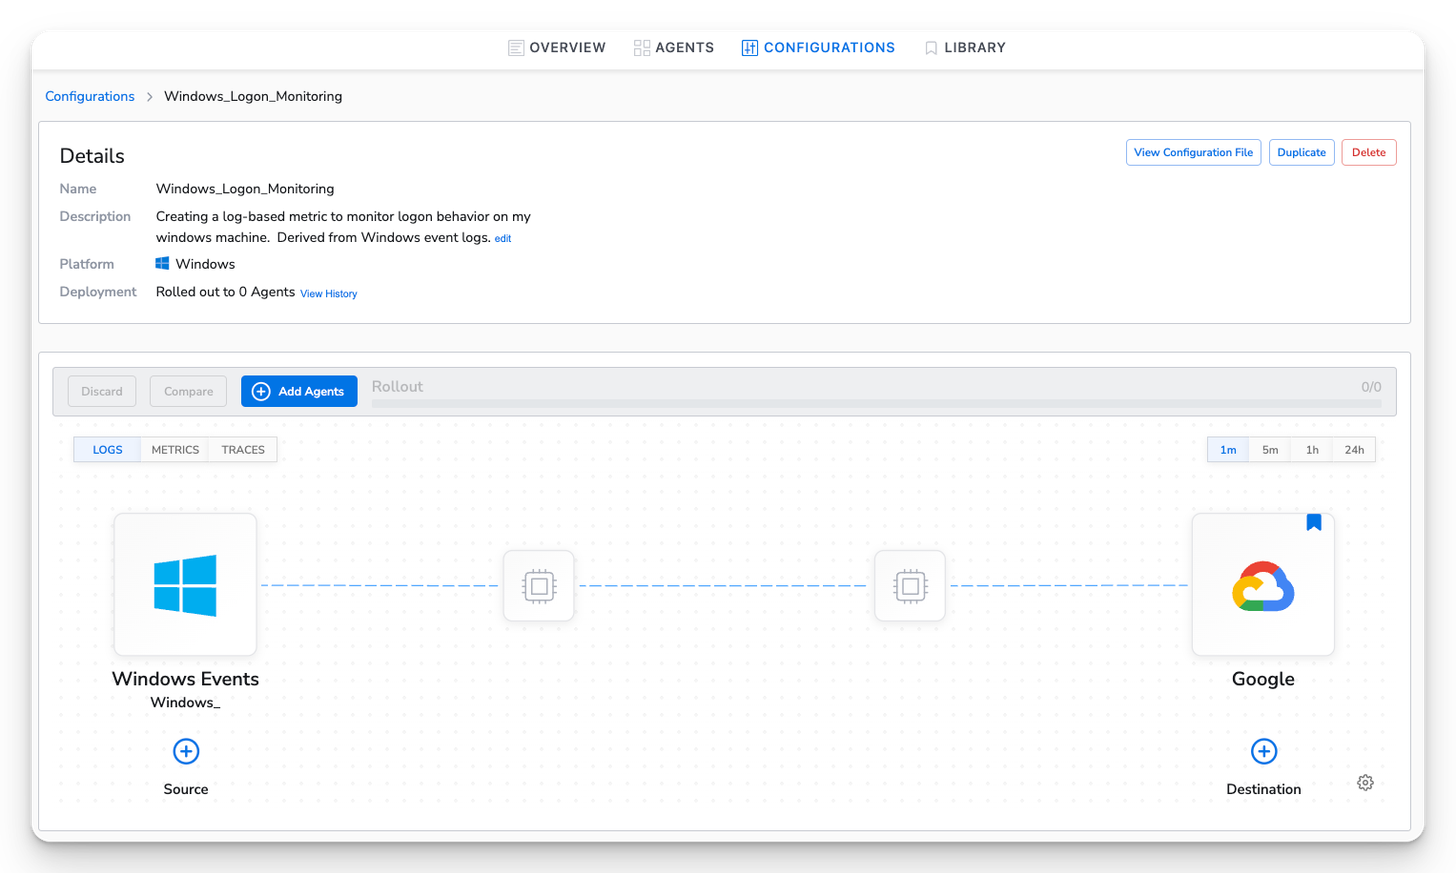
Lastly, I’ll add a Google Cloud Destination and save my configuration. Here’s the result.
Add Processors to your OTel configuration
Next, add the processors and deploy the configuration to an OTel collector from BindPlane.
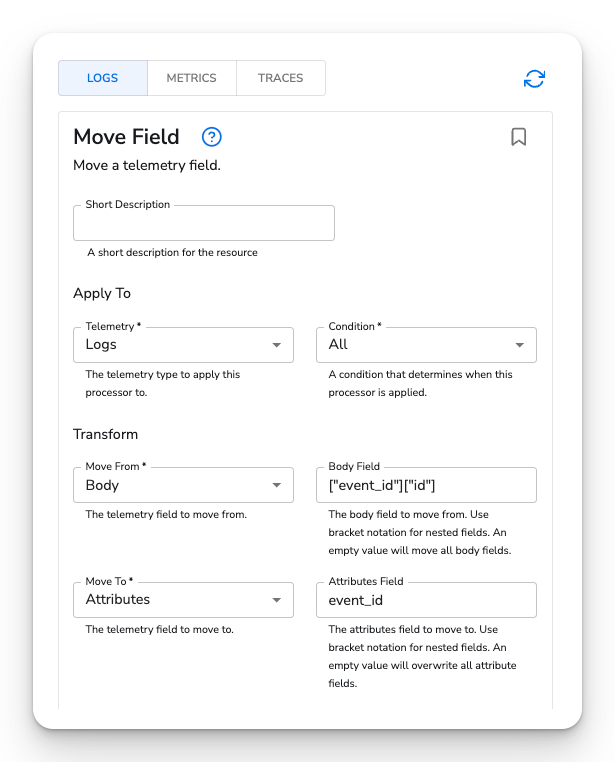
Move Field Processor
I want to dimension the metric I’m creating with the Windows event_id. To do so, I’ll need to move the event_id from the body of the message to an attribute
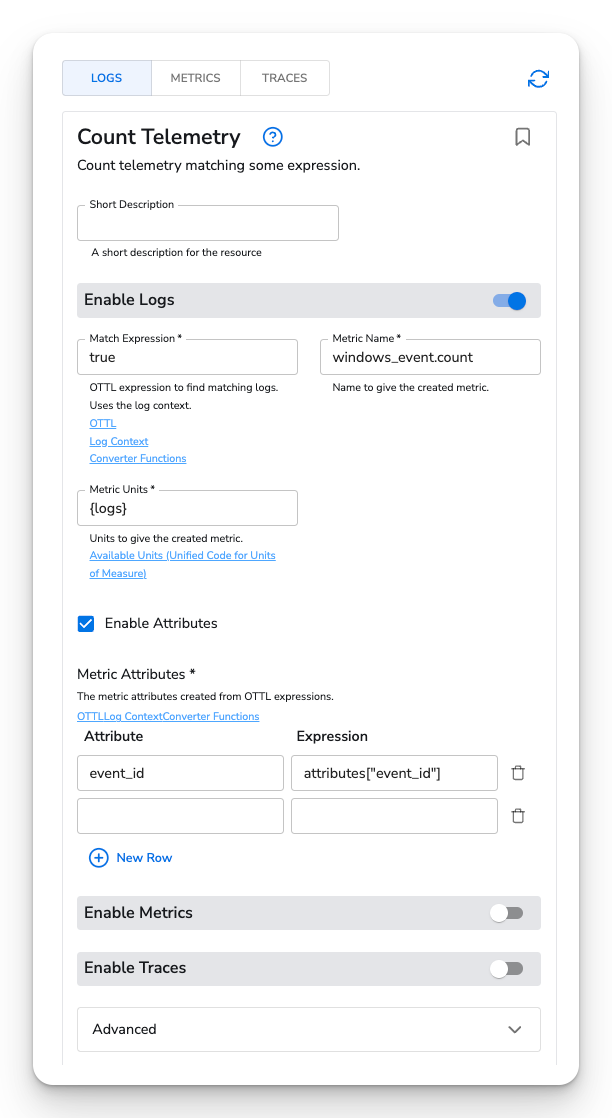
Count Telemetry Processor
Next, add the Count Telemetry Processor. I’ve named the metric windows_event.count and have added the event_id attribute we modified above.
Rollout your config and view the log-based metric
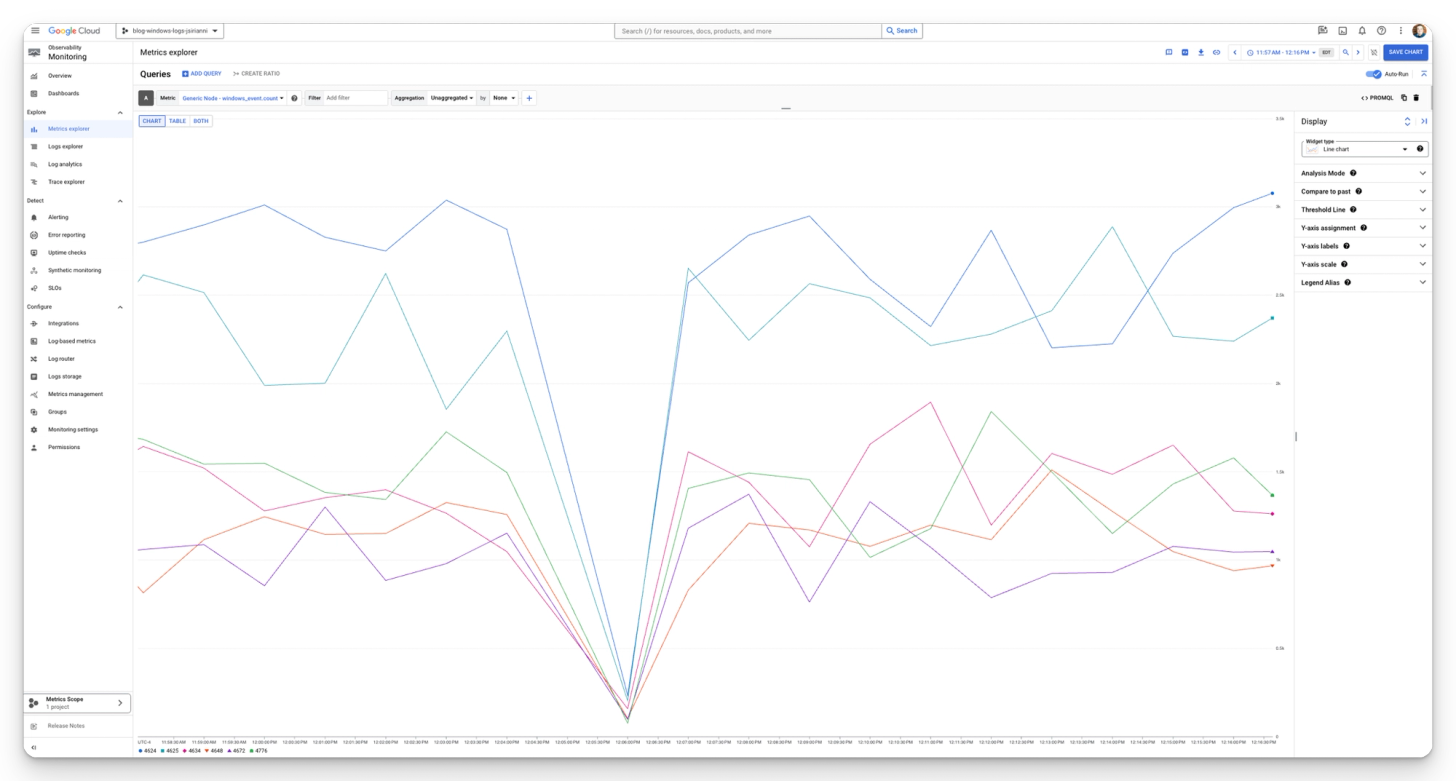
Lastly, I'll push the config to an OTel collector and head over to Google Cloud to verify that the new metric has arrived.
Voila!
And that’s a wrap! If you’re interested in OpenTelemetry or BindPlane OP or have any general questions, contact us at info@observiq.com or join us on BindPlane OP Slack to take the next step.


