The Observability Blog

Categories:
  • Log Management
  • Metrics
  • OpenTelemetry

How to Monitor SAP Hana with OpenTelemetry

Paul Stefanski headshot
by Paul Stefanski on
August 10, 2022

SAP Hana monitoring support is now available in the open source OpenTelemetry collector. You can check out the OpenTelemetry repo here! You can utilize this receiver in conjunction with any OTel collector: including the OpenTelemetry Collector and observIQ’s distribution of the collector.

Below are quick instructions for setting up observIQ’s OpenTelemetry distribution, and shipping SAP Hana telemetry to a popular backend: Google Cloud Ops. You can find out more on observIQ’s GitHub page: https://github.com/observIQ/observiq-otel-collector

What signals matter?

SAP Hana is a column-oriented relational database management system. It functions in-memory, so memory metrics are often important. Some specific metrics that users find valuable are:

  • Memory
    • Memory metrics offer information on current memory usage, minimum and maximum usage, and how memory is used between processes.
  • Backups
    • The age of the latest backup. This is important to monitor in case of an error or crash.
  • Replication Backlog
    • Monitor the size of the replication backlog in the cluster.

All of the above categories can be gathered with the SAP Hana receiver – so let’s get started.

Before you begin

If you don’t already have an OpenTelemetry collector built with the latest SAP Hana receiver installed, you’ll need to do that first. We suggest using the observIQ OpenTelemetry Collector distro that includes the SAP Hana receiver (and many others) and is simple to install with our one-line installer.

Configuring the SAP Hana receiver

Navigate to your OpenTelemetry configuration file. If you’re using the observIQ Collector, you’ll find it in one of the following locations: 

  • /opt/observiq-otel-collector/config.yaml (Linux)
  • C:\Program Files\observIQ OpenTelemetry Collector\config.yaml (Windows)

For the observIQ OpenTelemetry Collector, edit the configuration file to include the SAP Hana receiver as shown below:

receivers:
  saphana:
    endpoint: "localhost:33015"
    collection_interval: 60s
    metrics:
      saphana.cpu.used:
        enabled: false

Set up a destination for exporting the metrics as shown below. You can check the configuration for your preferred destination from OpenTelemetry’s documentation here.

exporters: 
  googlecloud:
    metric:
      resource_filters:
        - prefix: saphana

Set up the pipeline:

service:
  pipelines:
    metrics:
      receivers:
      - saphana
      exporters:
      - googlecloud

If you’re using the Google Ops Agent instead, you can find the relevant config file here.

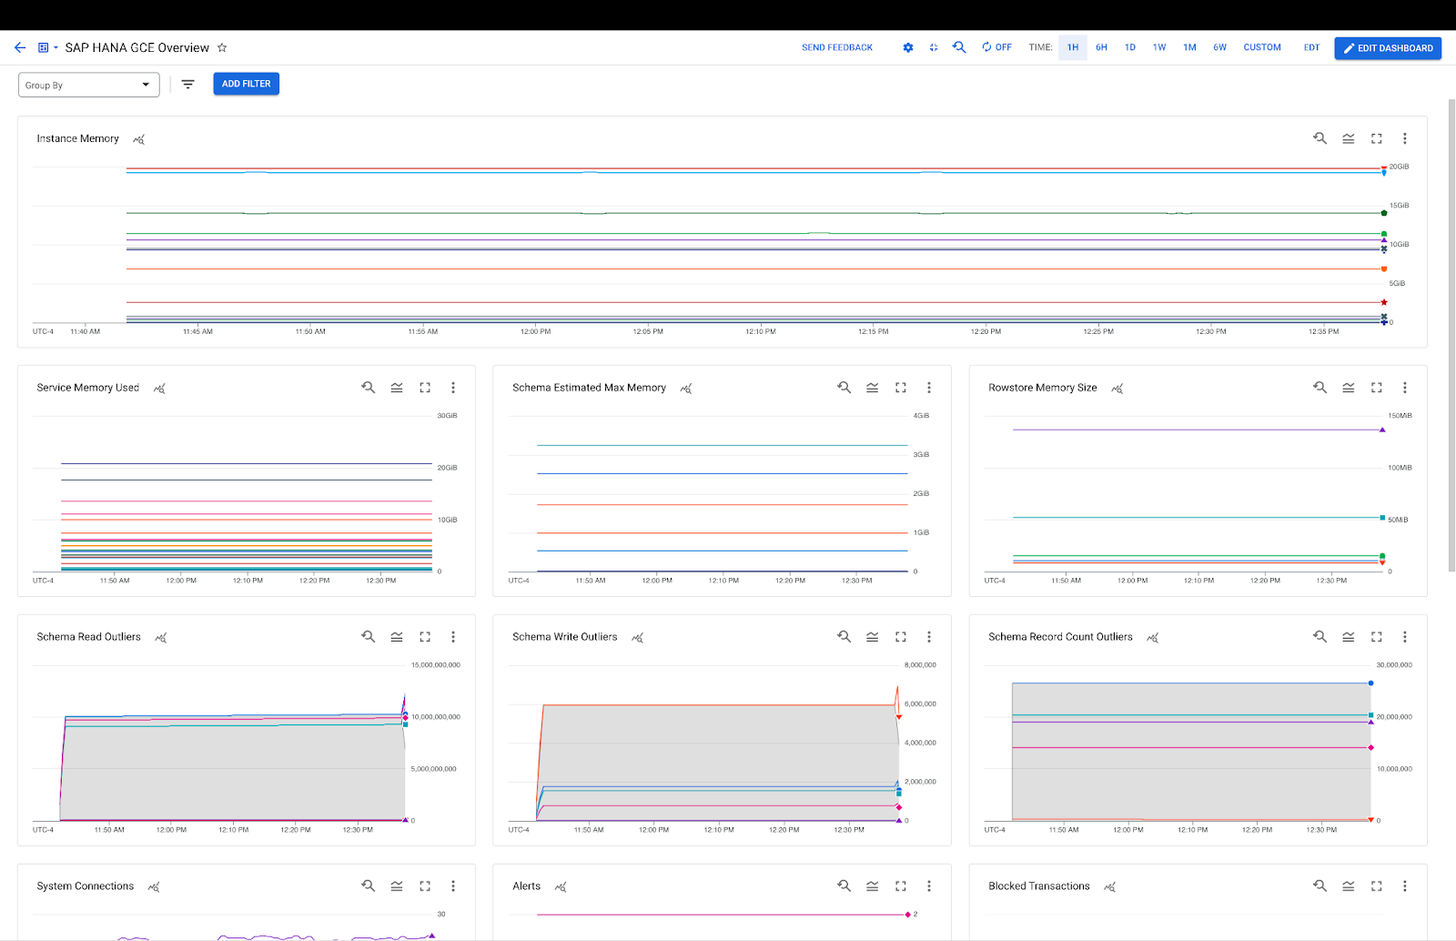
Viewing the metrics collected

If you followed the steps detailed above, the following SAP Hana metrics will now be delivered to your preferred destination.

MetricDescription
saphana.connection.count
The number of current connections.
saphana.cpu.usedTotal CPU time spent.
saphana.alert.countNumber of current alerts.
saphana.uptimeThe uptime of the database.
saphana.replication.backlog.timeThe current replication backlog.
saphana.replication.backlog.sizeThe current replication backlog size.
saphana.replication.average_timeThe average amount of time consumed replicating a log.
saphana.backup.latestThe age of the latest backup by start time.
saphana.transaction.countThe number of transactions.
saphana.transaction.blockedThe number of transactions waiting for a lock.
saphana.license.expiration.timeThe amount of time remaining before license expiration.
saphana.license.limitThe allowed product usage as specified by the license (for example, main memory).
saphana.license.peakThe peak product usage value during last 13 months, measured periodically.
saphana.instance.memory.currentThe size of the memory pool for all SAP HANA processes.
saphana.instance.memory.used.peakThe peak memory from the memory pool used by SAP HANA processes since the instance started (this is a sample-based value).
saphana.instance.code_sizeThe instance code size, including shared libraries of SAP HANA processes.
saphana.instance.memory.shared.allocatedThe shared memory size of SAP HANA processes.
saphana.host.memory.currentThe amount of physical memory on the host.
saphana.host.swap.currentThe amount of swap space on the host.
saphana.column.memory.usedThe memory used in all columns.
saphana.row_store.memory.usedThe used memory for all row tables.
saphana.component.memory.usedThe memory used in components.
saphana.schema.memory.used.currentThe memory size for all tables in schema.
saphana.schema.memory.used.maxThe estimated maximum memory consumption for all fully loaded tables in schema (data for open transactions is not included).
saphana.schema.record.countThe number of records for all tables in schema.
saphana.schema.record.compressed.countThe number of entries in main during the last optimize compression run for all tables in schema.
saphana.schema.operation.countThe number of operations done on all tables in schema.
saphana.service.countThe number of services in a given status.
saphana.service.thread.countThe number of service threads in a given status.
saphana.service.memory.usedThe used memory from the operating system perspective.
saphana.service.code_sizeThe service code size, including shared libraries.
saphana.service.stack_sizeThe service stack size.
saphana.service.memory.heap.current:
The size of the heap portion of the memory pool.
saphana.service.memory.shared.currentThe size of the shared portion of the memory pool.
saphana.service.memory.compactors.allocatedThe part of the memory pool that can potentially (if unpinned) be freed during a memory shortage.
saphana.service.memory.compactors.freeableThe memory that can be freed during a memory shortage.
saphana.service.memory.limitThe configured maximum memory pool size.
saphana.service.memory.effective_limitThe effective maximum memory pool size, calculated considering the pool sizes of other processes.
saphana.disk.size.current:The disk size.
saphana.volume.operation.count
The number of operations executed.
saphana.volume.operation.size
The size of operations executed.
saphana.volume.operation.time
The time spent executing operations.
saphana.network.request.count
The number of active and pending service requests.
saphana.network.request.finished.count
The number of service requests that have completed.
saphana.network.request.average_timeThe average response time calculated over recent requests

observIQ’s distribution of the OpenTelemetry collector is a game-changer for companies looking to implement OpenTelemetry standards. The single line installer, seamlessly integrated receivers, exporter, and processor pool make working with this collector simple. Follow this space to keep up with all our future posts and simplified configurations for various sources. For questions, requests, and suggestions, reach out to our support team at support@observIQ.com.