How to Monitor Zookeeper with OpenTelemetry

We are back with a simplified configuration for another critical open-source component, Zookeeper. Monitoring Zookeeper applications helps to ensure that the data sets are distributed as expected across the cluster. Although Zookeeper is considered very resilient to network mishaps, monitoring is inevitable. To do so, we’ll set up monitoring using the Zookeeper receiver from OpenTelemetry.
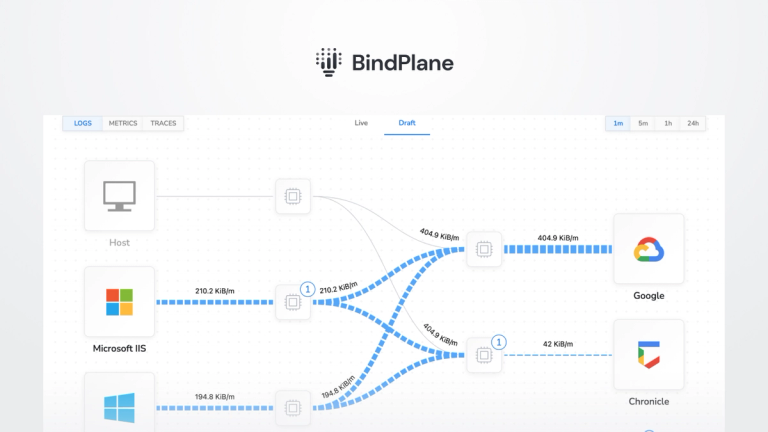
The configuration detailed in this post uses observIQ’s distribution of the OpenTelemetry collector. We are simplifying the use of OpenTelemetry for all users. If you are as excited as we are, look at the details of this support in our repo.
You can utilize this receiver in conjunction with any OTel Collector, including the OpenTelemetry Collector and observIQ’s distribution of the collector.
Monitoring performance metrics for Zookeeper is necessary to ensure that all the jobs are running as expected and the clusters are humming. The following categories of metrics are monitored using this configuration:
Znodes:
Automatically discover Zookeeper Clusters, monitor memory (heap and non-heap) on the Znode, and get alerts of changes in resource consumption. Automatically collect, graph, and get alerts on garbage collection iterations, heap size and usage, and threads. ZooKeeper hosts are deployed in a cluster, and as long as most hosts are up, the service will be available. Make sure the total node count inside the ZooKeeper tree is consistent.

Latency and throughput:
A consistent view of the performance of your servers, regardless of whether they change roles from Followers to Leader or back – you’ll get a meaningful view of the history.
Configuring the Zookeeper Receiver
After the installation, the config file for the collector can be found at:
- C:\Program Files\observIQ OpenTelemetry Collector\config.yaml (Windows)
- /opt/observiq-otel-collector/config.yaml(Linux)
Related Content: How to Install and Configure an OpenTelemetry Collector
Receiver Configuration:
- Configure the collection_interval attribute. It is set to 60 seconds in this sample configuration.
- Setup the endpoint attribute as the system that is running the Hadoop instance
1receivers:
2  zookeeper:
3    collection_interval: 30s
4 endpoint: localhost:2181Processor Configuration:
- The resource detection processor is used to create a distinction between metrics received from multiple Hadoop systems. This helps filter metrics from specific Redis hosts in the monitoring tool, such as Google Cloud operations.
- Add the batch processor to bundle the metrics from multiple receivers. We highly recommend using this processor in the configuration, especially for the benefit of the collector's logging component. If you would like to learn more about this processor check the documentation.
1processors:
2  resourcedetection:
3    detectors: ["system"]
4    system:
5      hostname_sources: ["os"]
6
7 batch:Exporter Configuration:
In this example, the metrics are exported to New Relic using the OTLP exporter. If you want to forward your metrics to a different destination, you can check the destinations OpenTelemetry supports here.
1exporters:
2  otlp:
3    endpoint: https://otlp.nr-data.net:443
4    headers:
5      api-key: 00000-00000-00000
6    tls:
7 insecure: falseSet up the pipeline:
1service:
2 pipelines:
3 metrics:
4 receivers:
5 - zookeeper
6 processors:
7 - resourcedetection
8 - batch
9 exporters:
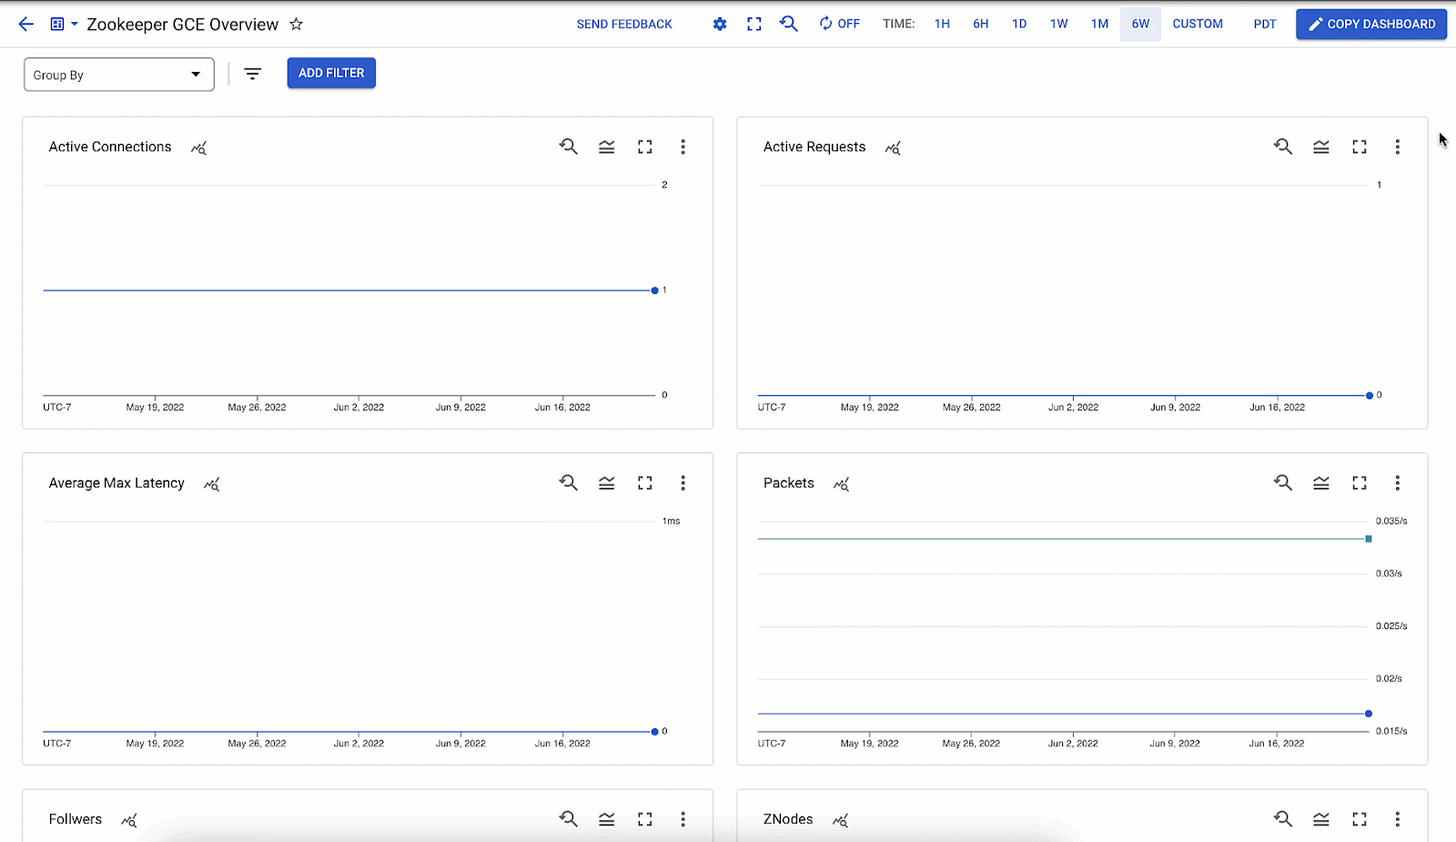
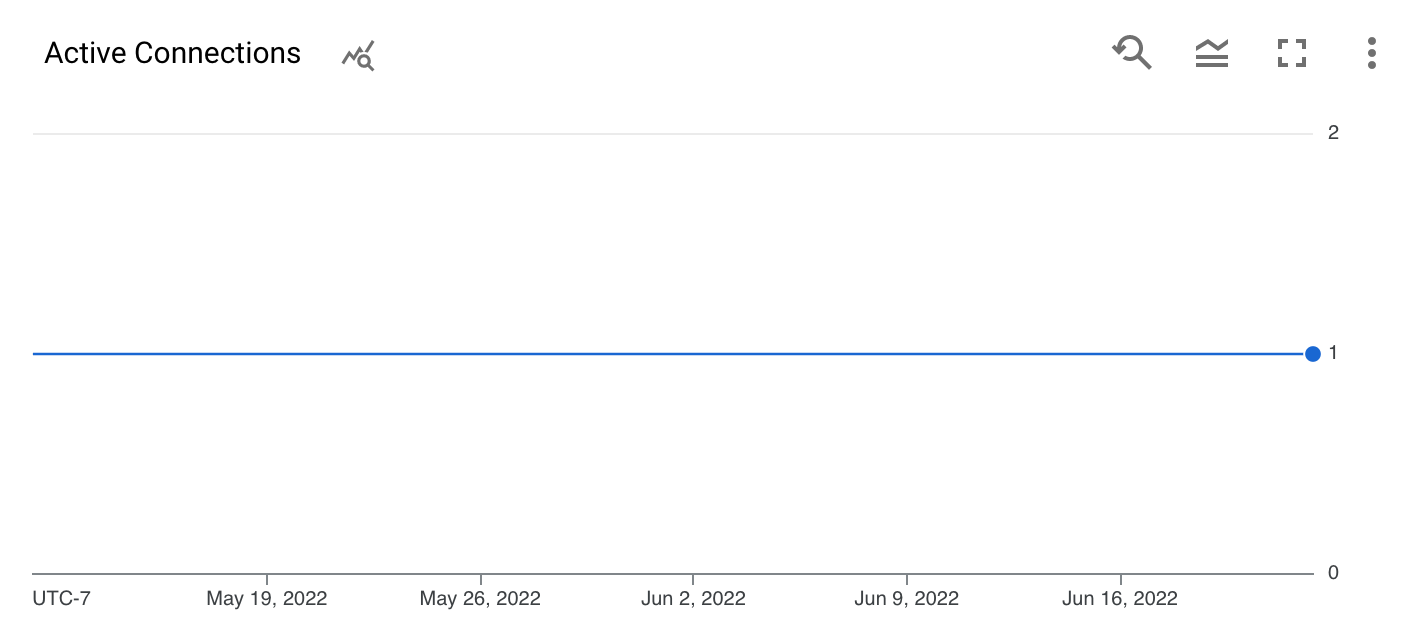
10 - otlpViewing the metrics
All the metrics the Zookeeper receiver scrapes are listed below.
Related Content: Managing Observability Pipeline Chaos and the Bottomline
Alerting
Now that you have the metrics gathered and exported to the destination of your choice, you can explore how to configure alerts for these metrics effectively. Here are some alerting possibilities for ZooKeeper:
observIQ’s distribution is a game-changer for companies looking to implement the OpenTelemetry standards. The single-line installer, seamlessly integrated receivers, exporter, and processor pool make working with this collector simple. Follow this space to keep up with all our future posts and simplified configurations for various sources. For questions, requests, and suggestions, contact our support team at support@observIQ.com or join the conversation on Slack!