How to Reduce the Volume of NGINX Logs
If you’ve worked with NGINX web servers, you know they’re efficient but can generate a lot of log data. While this data is valuable, sorting through it can be a challenge, and the storage and processing costs can quickly add up.
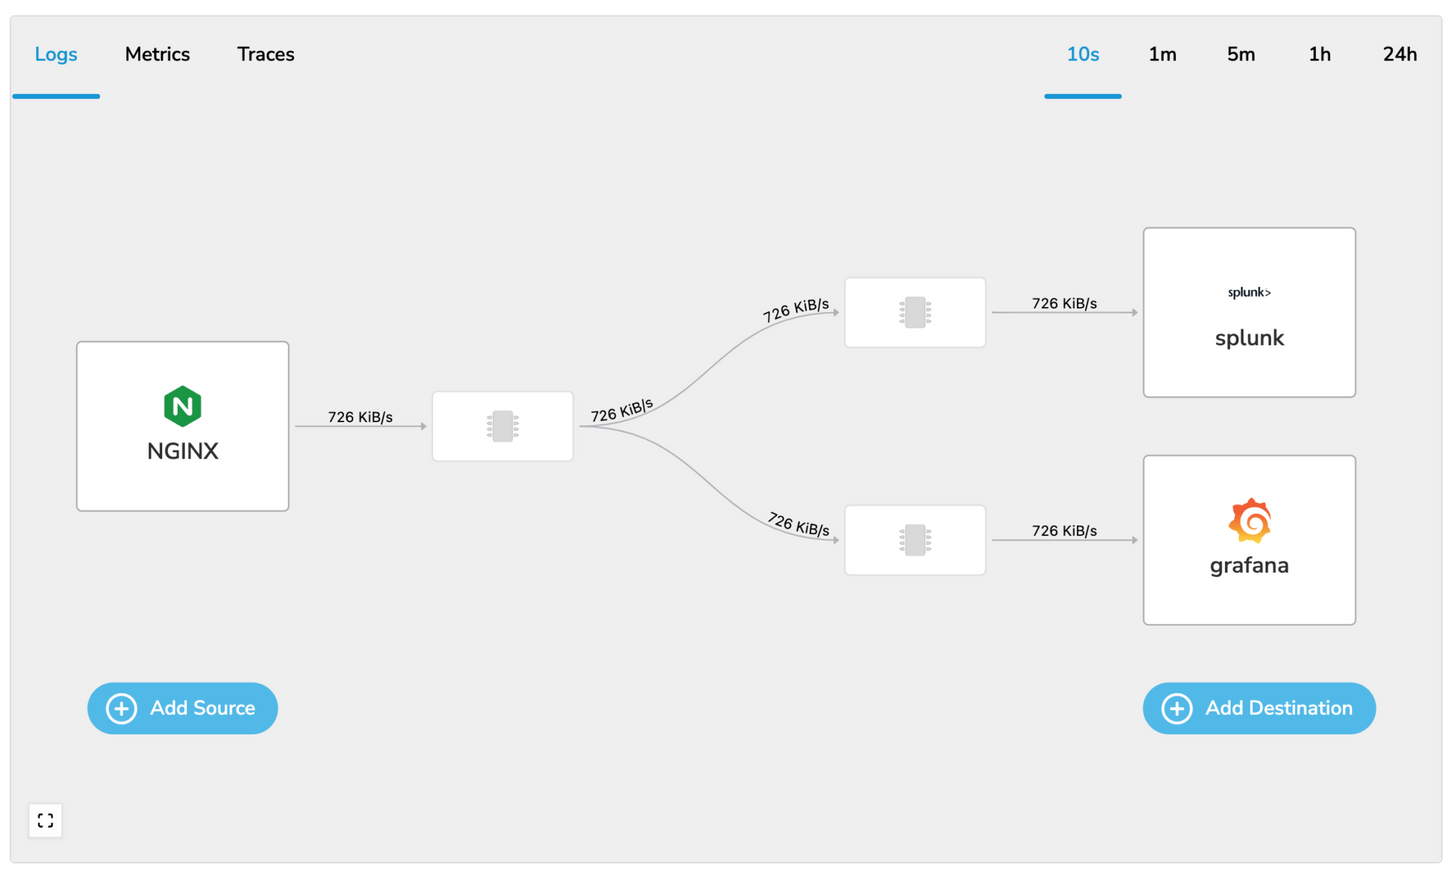
This is where BindPlane OP comes in. It helps reduce log volume while still preserving the crucial information. It streamlines your data, filters out the irrelevant bits, and zeroes in on key data points, helping manage storage and keep costs under control.
In this post, we’ll guide you through refining an NGINX log data stream using BindPlane OP. We’ll dive into how to extract valuable metrics and reduce log volume by filtering out unnecessary logs. By the end of this, you’ll be able to navigate your log analysis process more efficiently, saving time and money.
Creating Metrics From Logs
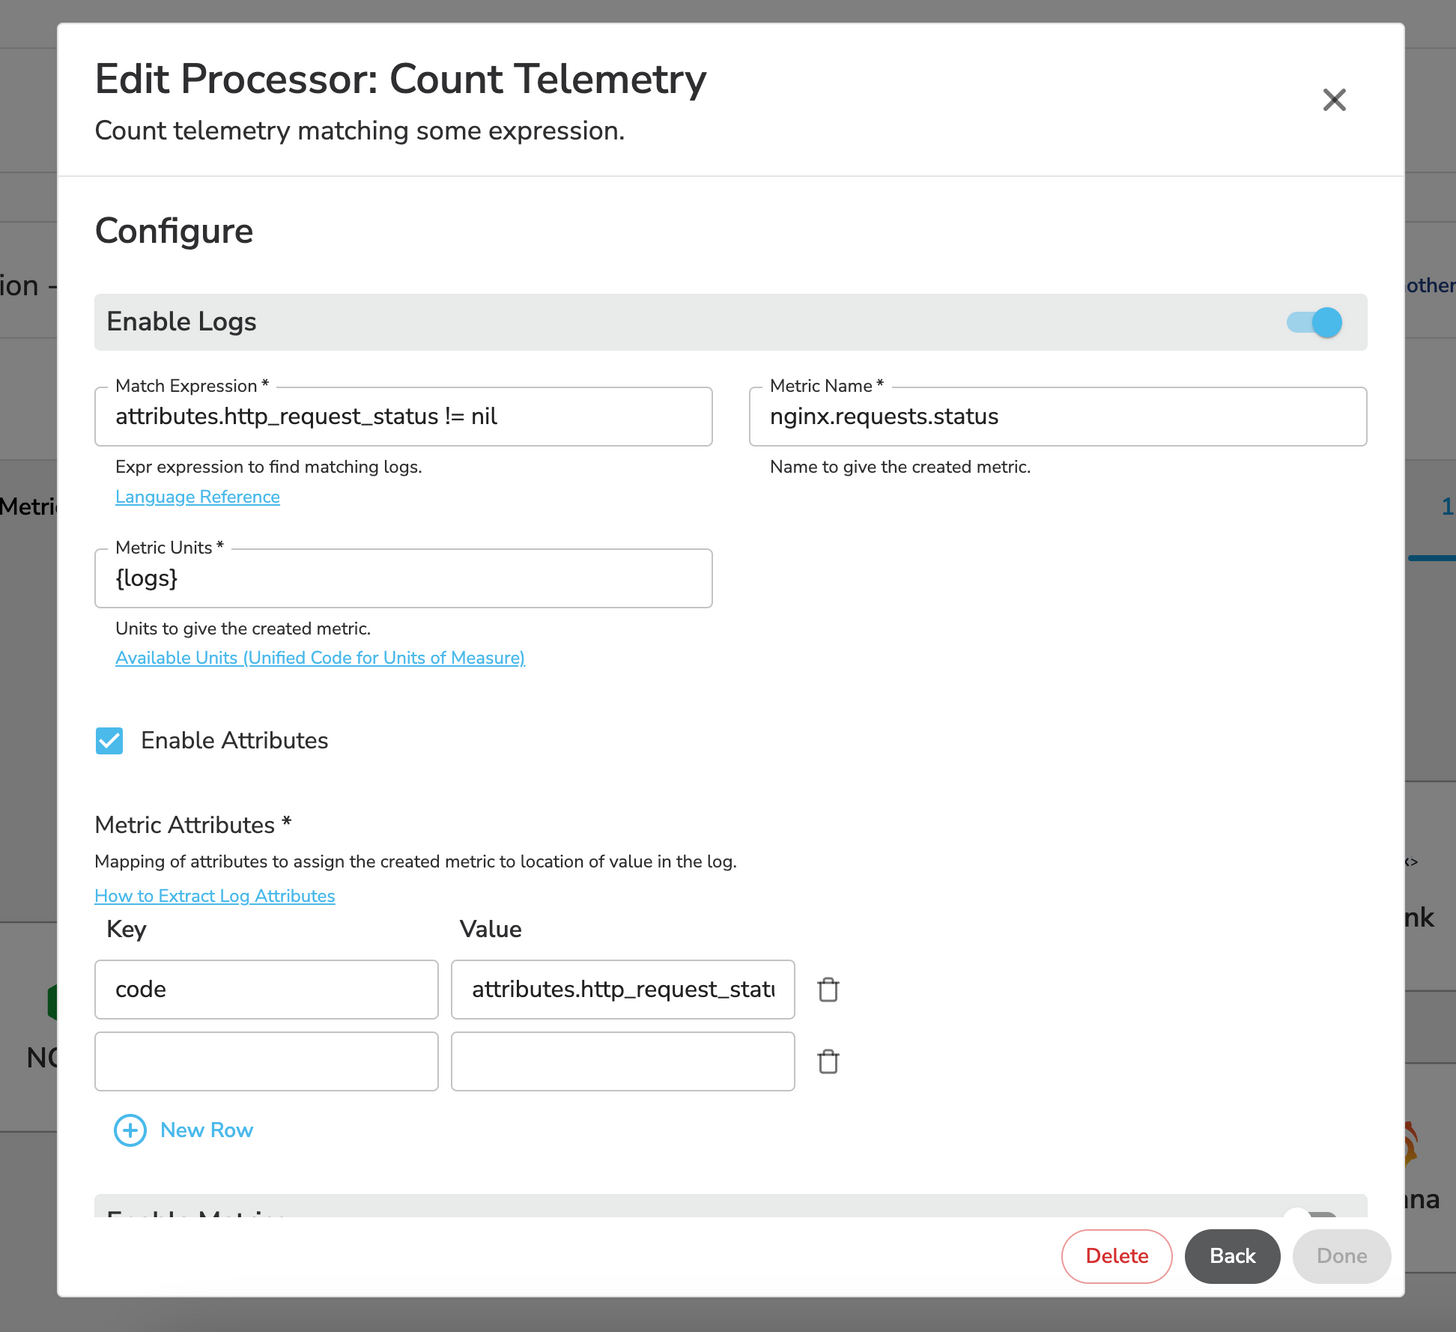
The first step in taking control of your NGINX log data stream is to squeeze out some value from those logs by crafting meaningful metrics. That’s where the Count Telemetry processor in BindPlane OP comes into play. This processor counts the number of logs that meet a certain condition and generates a new metric. This means you keep the crucial info but can let go of some logs from the pipeline.
Configuring the Count Telemetry Processor
Getting the most out of the Count Telemetry processor means setting it up right. We’re going to make two unique metrics. Here’s how:
The first is for counting logs dimensioned by http status code:
- Click a processor node in your pipeline
- Add Processor
- Count Telemetry
- Enable Logs
- Configure the processor as follows:
- Match Expression:
attributes.http_request_status != nil- The match expression defines the logs you’d like to match against (and therefore count). In this example we want all logs that have an http_request_status
- Metric Name: nginx.requests.status
- Enable Attributes:
- Key: code
- Value:
attributes.http_request_status
- Collection Interval: 60
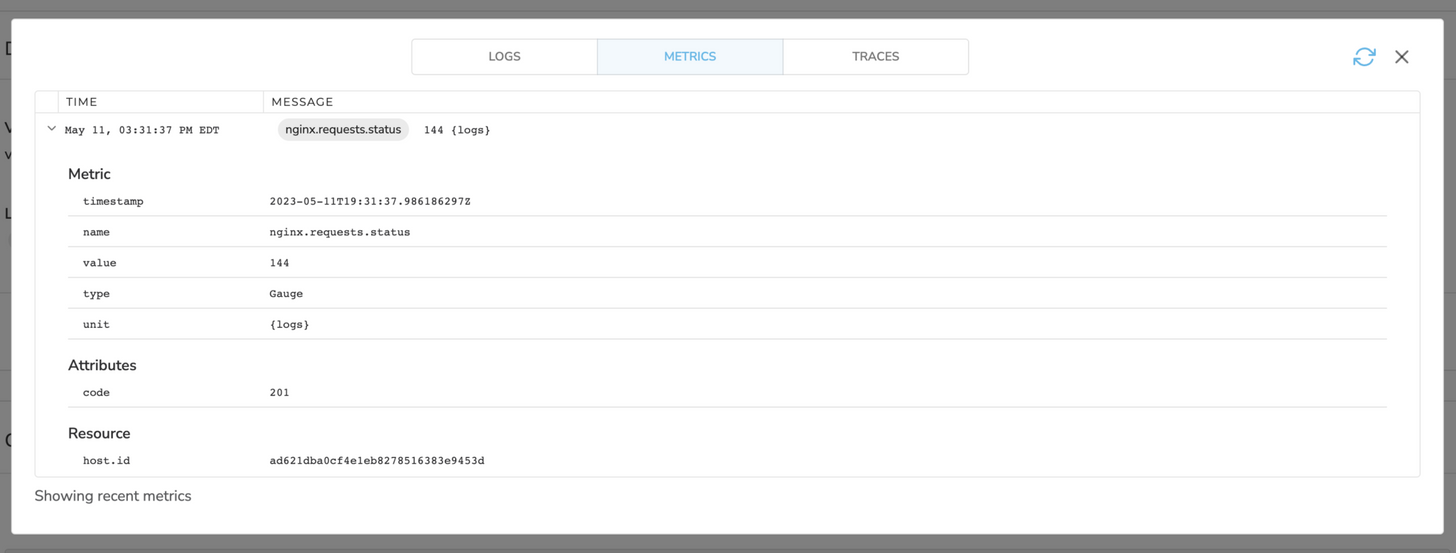
- Match Expression:
If you’ve done this correctly, here’s what the resulting metric will look like:
The second is for counting logs and dimensioned by the the path of the request:
- Repeat steps 1-4 above
- Configure the processor as follows:
- Match Expression: true
- Metric Name:
nginx.requests.path - Enable Attributes:
- Key: path
- Value:
attributes.http_request_requestUrl
- Collection Interval: 60
Reducing Log Volume by Dropping Health Check Logs:
After we’ve pulled metrics from our logs, we can trim down our data stream even more by cutting the log volume. A great way to do this is by dropping logs for paths you don’t find valuable. In this example we’re going to drop health checks, but you should adopt this to fit your needs. This step can lead to a substantial reduction in log volume.
Configuring a Processor to Exclude Health Check Logs:
To implement this, we’ll configure a new processor using the Log Record Attribute Filter.
- Click a processor node in your pipeline
- Add Processor
- Log Record Attribute Filter
- Action: Exclude
- This will exclude the logs the processor matches
- Match Type: Strict
- Attributes:
- Key:
http_request_requestUrl - Value: /health
- Key:
In our example, this process results in a 14% reduction in log volume, making our log analysis process more manageable and efficient.
By following the steps outlined in this guide, you’ll be well-equipped to manage and refine your NGINX log data stream using BindPlane OP, leading to better insights, improved system performance, and significant cost savings.
Get started today by installing BindPlane OP and joining our Slack community where we can help you start reducing your telemetry data.


