Kubernetes Logging Simplified – Pt 1: Applications
If you’re running a fleet of containerized applications on Kubernetes, aggregating and analyzing your logs can be a bit daunting without the proper knowledge and tools. Thankfully, there’s plenty of helpful documentation to help you get started; observIQ provides the tools to quickly gather and analyze your application logs. In the first part of this blog series, Kubernetes Logging Simplified, I’ll highlight a few ‘need to know’ concepts so you can start digging into your application logs quickly.
Kubernetes Logging Architecture – A Few Things You Need to Know
Standard Output and Error streams
The simplest logging method for containerized applications is writing to stdout and stderr. If you’re deploying an application, it’s best practice to enable logging to stdout and stderr or build this functionality into your custom application. Doing so will streamline your overall Kubernetes logging configuration and help facilitate the implementation of a Cluster-Level Logging solution.
Cluster-Level Logging
Out of the box, Kubernetes and container engines do not provide a complete Cluster-Level Loggingsolution, so it’s essential to implement a logging backend like ELK, Google Cloud Logging, or observIQ to ensure you can gather, store and analyze your application logs as the state and scale of your cluster changes.
Node-Level Logging
For applications that log to stdout and stderr, the Kubelet will detect and hand them off to the container engine and write the streams to a path on your node. This behavior is determined by the logging driver you’ve configured. For Docker and containers, this path typically defaults to /var/log/containers. A Node Log Agent architecture is recommended to gather these logs, which I’ll touch on below.
Node-Level Log Rotation*
As application logs will ultimately be written to your nodes, it’s essential to administer a Node log rotation solution, as filling Node storage could impact the overall health of your cluster. Depending on how you deploy your Cluster, node log rotation may or may not be configured by default. For example, if you deploy using kube-up.sh, logrotate will be configured automatically. If you’re using Docker, you can set max-size and max-file options using log-opt.
Where Can I Find More?
The Kubernetes docs outline logging architecture in a pretty straightforward and concise way. This blog focuses on application logs, but If you’re just getting started with Kubernetes, I’d encourage you to check out the following links better to understand container, system, and audit logging.
https://kubernetes.io/docs/concepts/cluster-administration/logging/
https://kubernetes.io/docs/concepts/cluster-administration/system-logs/
https://kubernetes.io/docs/tasks/debug-application-cluster/audit/
How Do I Get Application Logs From Kubernetes?
You can gather your application in several ways, manually via the command line or implementing a Cluster-level logging architecture described below.
Manual Commands
Before implementing a complete Cluster-level loggingsolution, it’s helpful to familiarize yourself with some basic commands to access, stream and dump your application logs manually.
Cheat Sheet
For a quick list, check out the kubectl cheat sheet here:
https://kubernetes.io/docs/reference/generated/kubectl/kubectl-commands#logs
Complete list
For a complete list of kubectl commands, check out the docs here: https://kubernetes.io/docs/reference/generated/kubectl/kubectl-commands#logs
Custom utilities worth checking out
Stern – https://github.com/wercker/stern
Kubetail – https://github.com/johanhaleby/kubetail
Kail – https://github.com/boz/kail
Cluster-Level Logging Architecture
When you are ready to implement Cluster-level logging, there are a few primary architectures you should consider:
Node Log Agents (recommended)
To best leverage Node-level logging, you can deploy a log agent like Fluentd, Logstash, or observIQ log agent to the nodes in your cluster to read your application logs and ship logs to your preferred backend. Typically, it’s recommended that the agent be run as a Dameonset, which deploys an agent for each node in the cluster. At observIQ, we recommend deploying Node Log Agents as the most straightforward and efficient method to gather your application logs.
Stream Sidecar
If your application can’t log to stdout and stderr, you can use a Stream Sidecar. The Stream Sidecar can grab logs from an application container’s filesystem and then stream them to its own stdout and stderr streams. Like Node log agents, this is another path to get the application logs written on the Node.
Agent Sidecar:
If your application can’t log to stdout and stderr, you can deploy a log agent as a sidecar, which can grab the logs from your application container’s filesystem and send them to your preferred backend.
Deploying Kubernetes Cluster-level Logging with observIQ
Now that we’ve completed the basic architectures let’s walk through setting up Cluster-level logging with observIQ. With observIQ, you can quickly implement Node-level logging agent architecture, deploying the observIQ log agent as a Daemonset and gathering the logs from a single, many, or all of your containerized applications in a few simple steps.
Create a Kubernetes Template
What is a Template?
A template in observIQ is an object that allows you to manage the same logging configuration across multiple agents, all from a single place in the UI. It also allows you to define and update logging configuration before and after you deploy observIQ agents, which I’ll be exploring more in my next post in the series.
Add a new Template
To create a Template, navigate to the Fleet > Templates page in observIQ, select ‘Add Template,’ and then select ‘Kubernetes’ as the platform.
In this example, specify a friendly name for your cluster, GKE US East 1, and choose ‘Enable Container Logs’. From here, you can specify a specific pod or container, leave the default option, and gather logs from all pods and containers. In this case, I will leave the default options and gather all the application logs from my cluster. Then click ‘Create’.
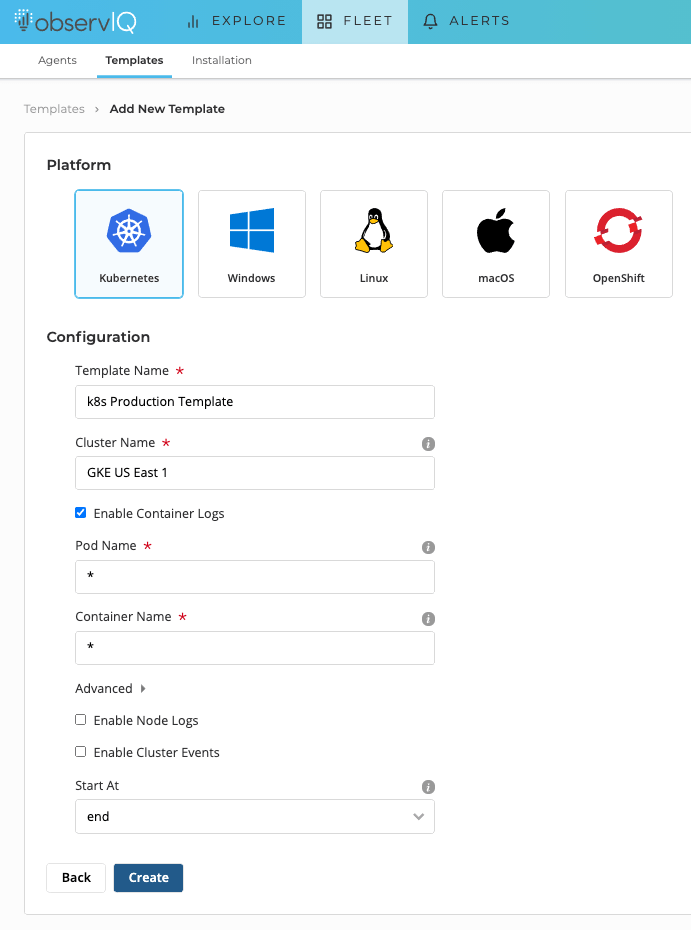
Creating a Kubernetes Template
Deploy observIQ to your Kubernetes Cluster
Once you have your Template created, click ‘Add Agents’.
On the Install Kubernetes Agents page, download and copy the observiq-agent.yaml to your cluster, and apply by running kubectl apply -f observiq-agent.yaml command.
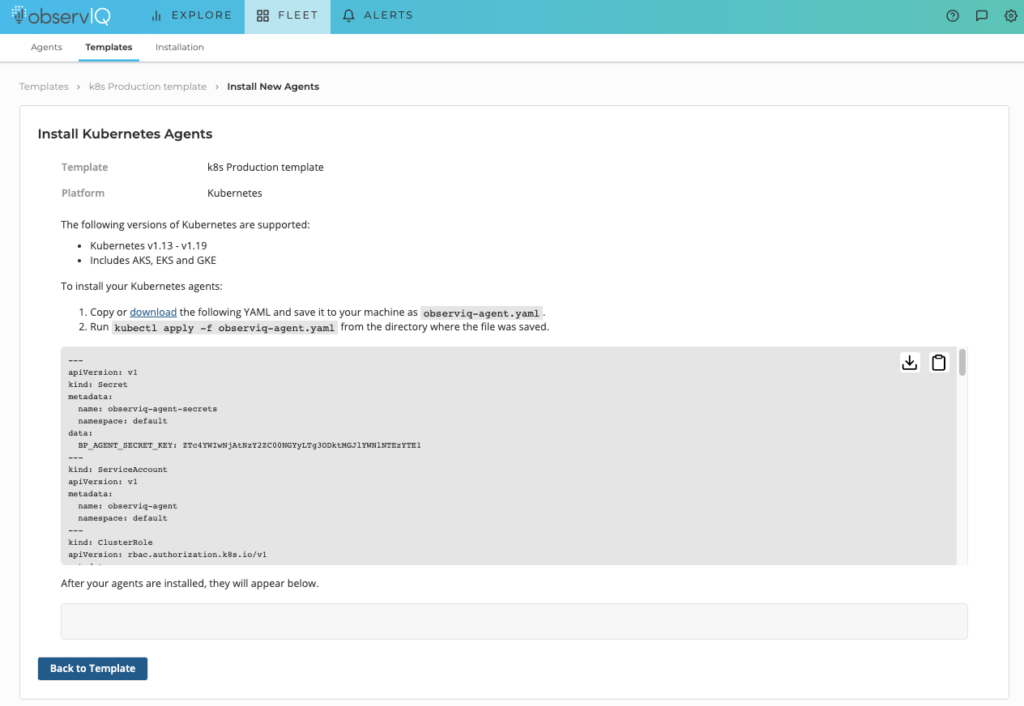
Install the Kubernetes Agents page
After a few minutes, observIQ agents will be running in your cluster. If you run kubectl get pods | grep observing-agent, you’ll see an observIQ Agent for each node in your cluster. If you return to your template, you’ll also see each of these agents related to your Template. A good thing to know is that if you want to make configuration changes to your agents, you can now modify Agent configuration directly from the Templates.
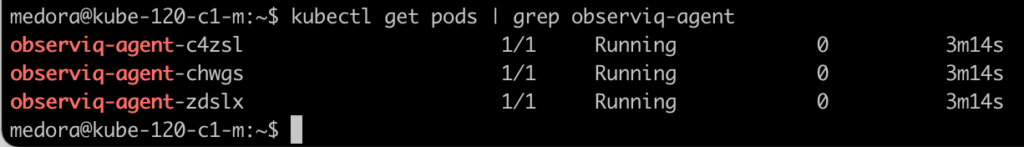
Kubectl get pods | grep observiq-agent
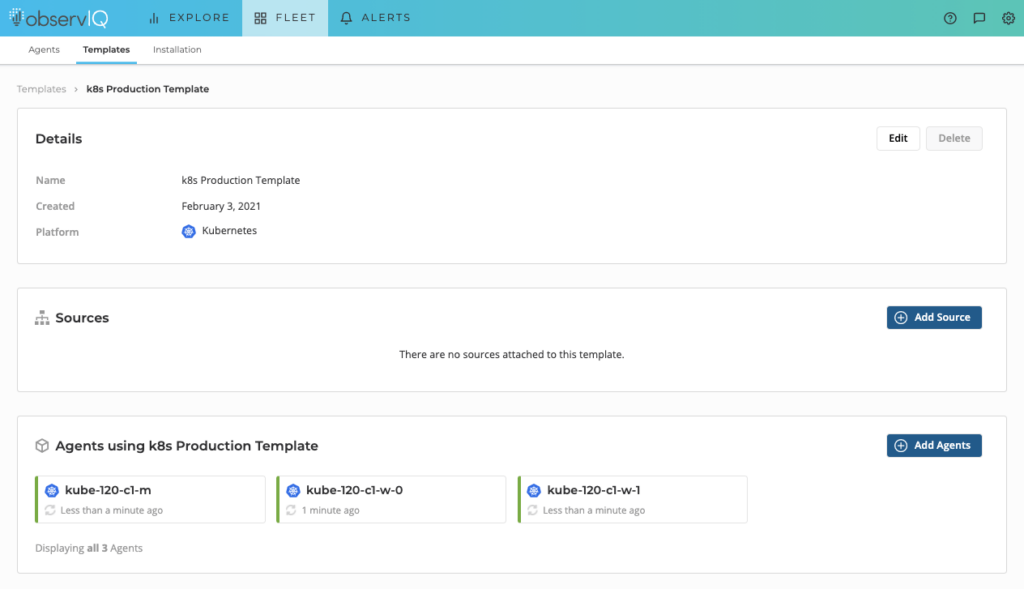
Kubernetes agents associated with Template
View your Application Logs in observIQ
After a few minutes, your application logs appear on the observIQ Explore page. The messages will be labeled with the type k8s.container.
When opening one of the application logs, you can see application messages, proper labels, and metadata automatically added to help trace the message to your specific application.
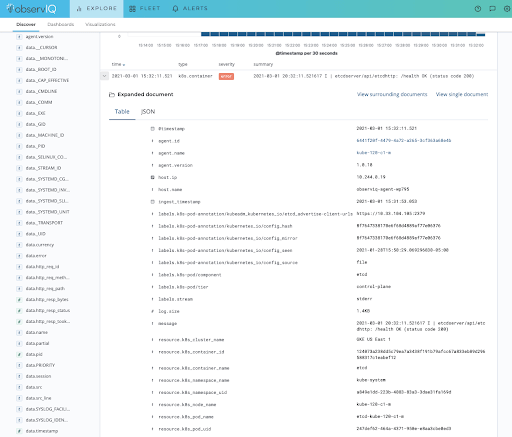
Application log in observIQ with Kubernetes Labels and Metadata
Wrapping up
Gathering your application logs is critical to understanding and debugging application workloads. Knowing manual commands is helpful, but as your application and cluster scales, it’s essential to implement a Cluster-level logging solution that fits your environment and requirements.
In my next post, I’ll dive into System and Cluster events and step through how to quickly ship and analyze your logs with observIQ.


