Kubernetes Logging Simplified – Pt 2: Kubernetes Events
Overview
In my first post in the Kubernetes Logging Simplified blog series, I touched on some of the ‘need to know’ concepts and architectures to effectively manage your application logs in Kubernetes – providing steps on how to implement a Cluster-level logging solution to debug and analyze your application workloads.
In my second post, I will touch on another signal to keep an eye on Kubernetes events. Kubernetes events are essential objects that can provide visibility into your cluster resources and help correlate with your application and system logs.
What is a Kubernetes Event?
Kubernetes events are JSON objects made accessible via the Kubernetes API that signify a state change of a Kubernetes resource. These changes are reported to the API using their related component. For example, suppose a pod is evicted or created. In that case, a container fails to start, or a node restarts – all these state changes would generate a Kubernetes Event, made accessible via API via kubectl commands.
Unlike container logs, Kubernetes events don’t ultimately get logged to a file somewhere; Kubernetes lacks a built-in mechanism to ship these events to an external backend. As a result, attempting to utilize a typical node-level log agent architecture to grab these events may not work. These events can be captured with a custom application, several OSS tools, or an observIQ Event Collector, which I’ll walkthrough below.
What information does a Kubernetes Event Contain?
In addition to helpful environment metadata, a Kubernetes Event contains the following key bits of information.
- When the event occurred
- Severity of the event (info, warning, error)
- Reason the event occurred (abbreviated description of the event)
- Kind of Kubernetes resource (node, pod, container)
- Description of the event
- Component that reported the event (kubelet, kube-proxy, kube-API, etc.)
Why is a Kubernetes Event Useful for Capturing?
Postmortems
Tracking Kubernetes Events can help you understand what’s happening in your cluster over time, which can be particularly helpful when reviewing during a postmortem. Digging into the ‘when’ and ‘why’ over time can reveal useful trends and a good discussion point when an application or service fails.
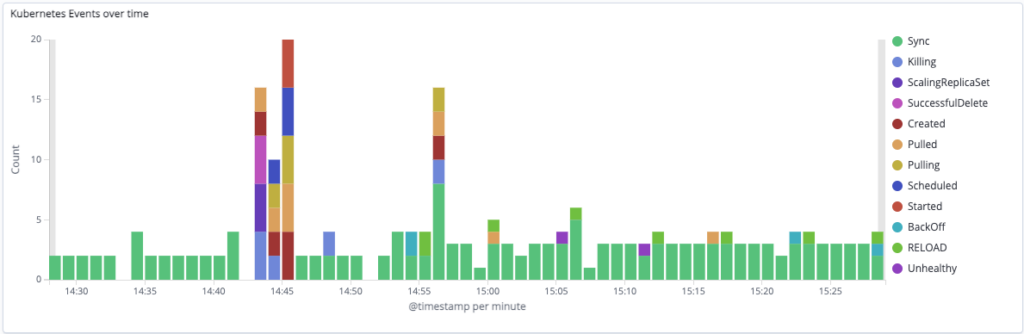
Custom Kubernetes Events dashboard in observIQ
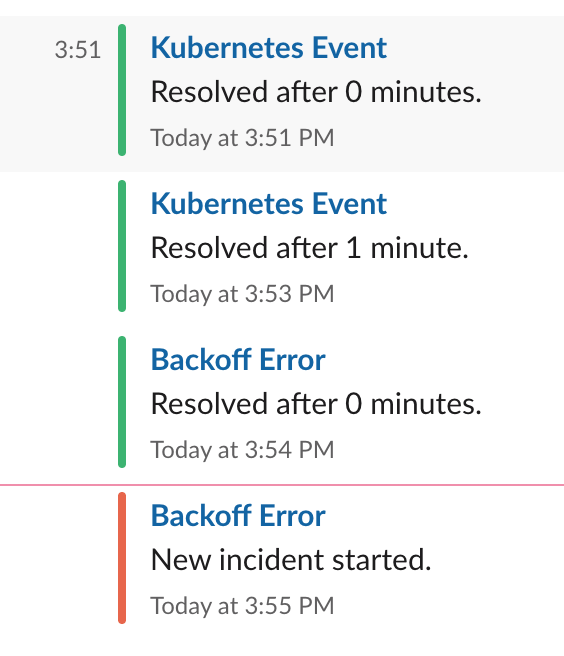
Real-Time Environment Awareness
Suppose you’re using a complete Cluster-Level Logging solution likeobservIQ. In that case, KubernetesEvents can be used to create informational or error-level alerts that notify Slack, for example, that provide real-time notifications that can keep your entire time in the loop as the state of your cluster resources changes.
Container Log Correlation
Having visibility into the state of your resources can help provide valuable hints as to what’s happening with your applications. Kubernetes Events gathered by observIQ are automatically enriched with Kubernetes Metadata like namespace, deployment, and pod names – all of which allow you to correlate an application log directly to a resource event with a single filter.
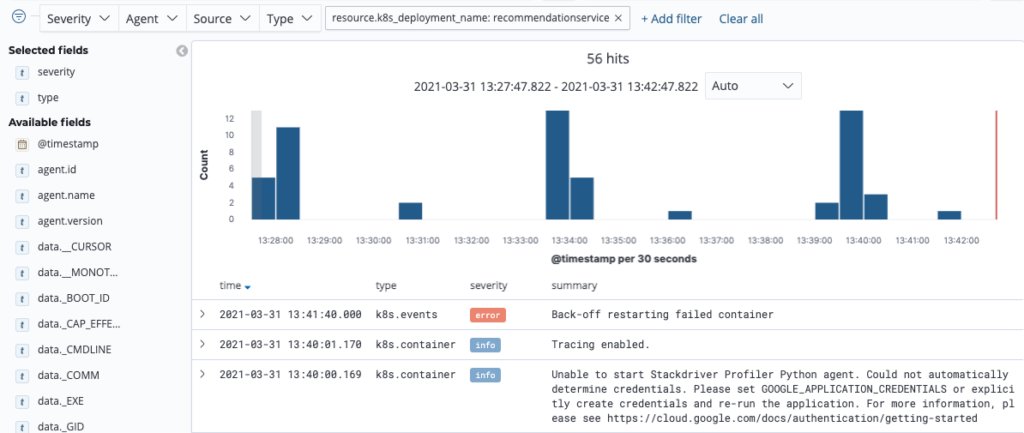
Correlating container logs and Kubernetes events with a resource filter in observIQ
How do I get Kubernetes Events?
By default, events are stored in etcd for a limited time, typically ~60 minutes, and are made accessible by kubectl commands. Though the commands are helpful to learn and employ in certain situations, utilizing a custom application or implementing a complete Cluster-level logging solution that captures, ships, and stores events for long-term analysis is highly recommended.
Accessing Kubernetes Events with Kubectl
Here are a few commands that will allow you to see your events:
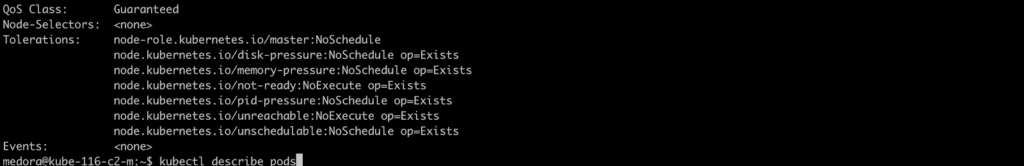
kubectl describe pods
Describing a pod will provide you with related Kubernetes event information, if available:
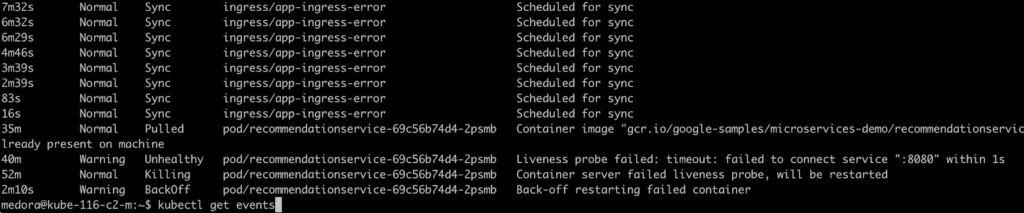
kubectl get events
Provides a list of current Kubernetes events for all resources:
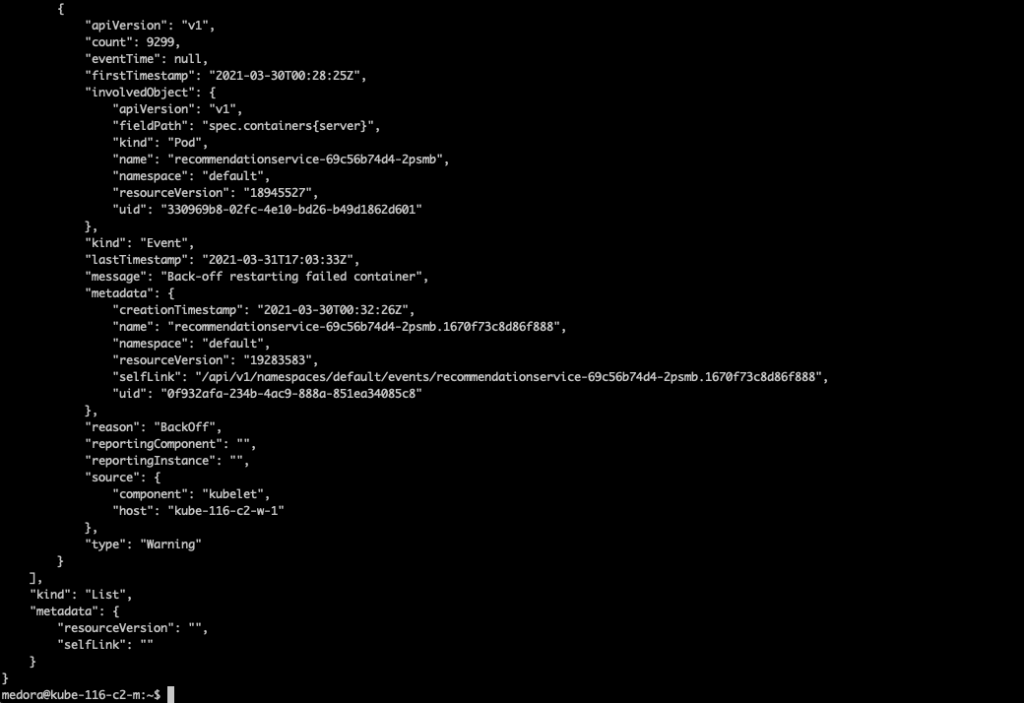
kubectl get events -o json
Same as above, but each Kubernetes Event is presented as the raw JSON object:
Accessing Kubernetes Events with OSS Tools:
Both kube-events and Kubernetes-event-exporter are nifty, highly customizable tools that can capture and forward Kubernetes events to a preferred output or sink (e.g., S3, Kafka, etc.)
Kube Events
https://github.com/kubesphere/kube-events
Kubernetes Event Explorer
https://github.com/opsgenie/kubernetes-event-exporter
Accessing Kubernetes Events with observIQ
With observIQ, you can easily enable Kubernetes Event collection by deploying the observIQ log agent as an Event Collector. Just select the option on your Kubernetes Template.
See the steps below:
Deploying the observIQ Agent as a Kubernetes Event Collector
In my first post in the series, I explored how to create a Kubernetes Template and enable container log collection. With observIQ, you can easily enable or disable logging options from your template, even after you’ve deployed agents to your cluster. In this example, we’ll allow event collection in our existing template, re-apply the observ-agent.yaml, and add an observIQ Event Collector to our existing deployment. This will leave us with 1) an observIQ agent daemonset that will gather the application’s logs and 2) a single Event Collector deployment that will gather the Kubernetes Events, running side by side.
Update your Kubernetes Template in observIQ
You can just navigate to the Fleet > Templates page and choose your previously created Kubernetes template. Select the ‘Enable Cluster Events’ option, then click ‘Update’.
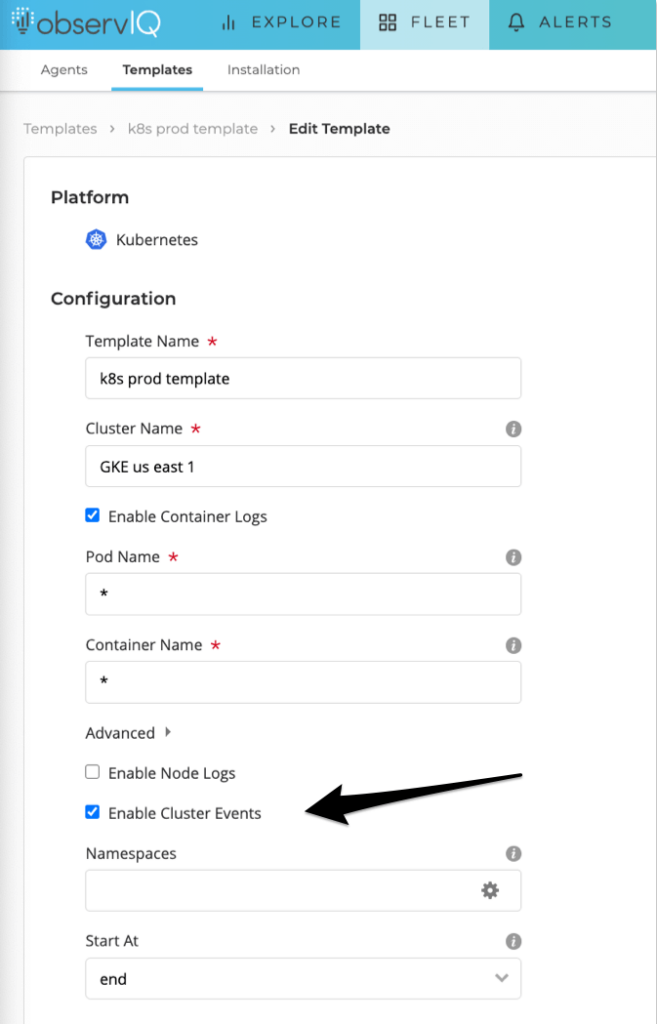
Enabling Kubernetes Events in observIQ Kubernetes Template
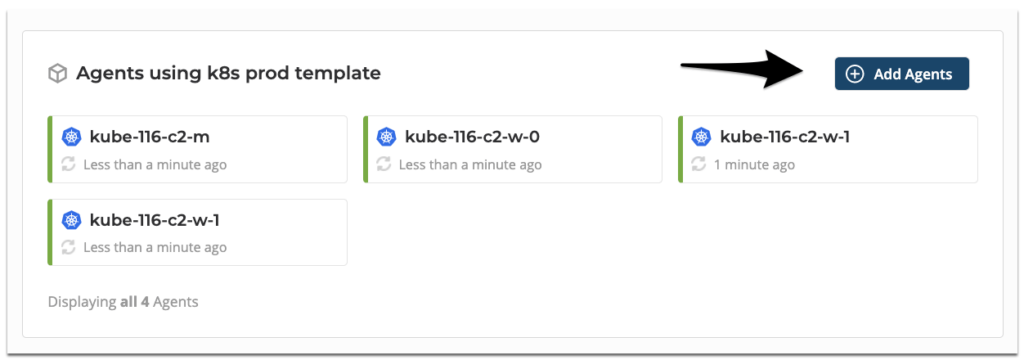
Next, click ‘Add Agents’.
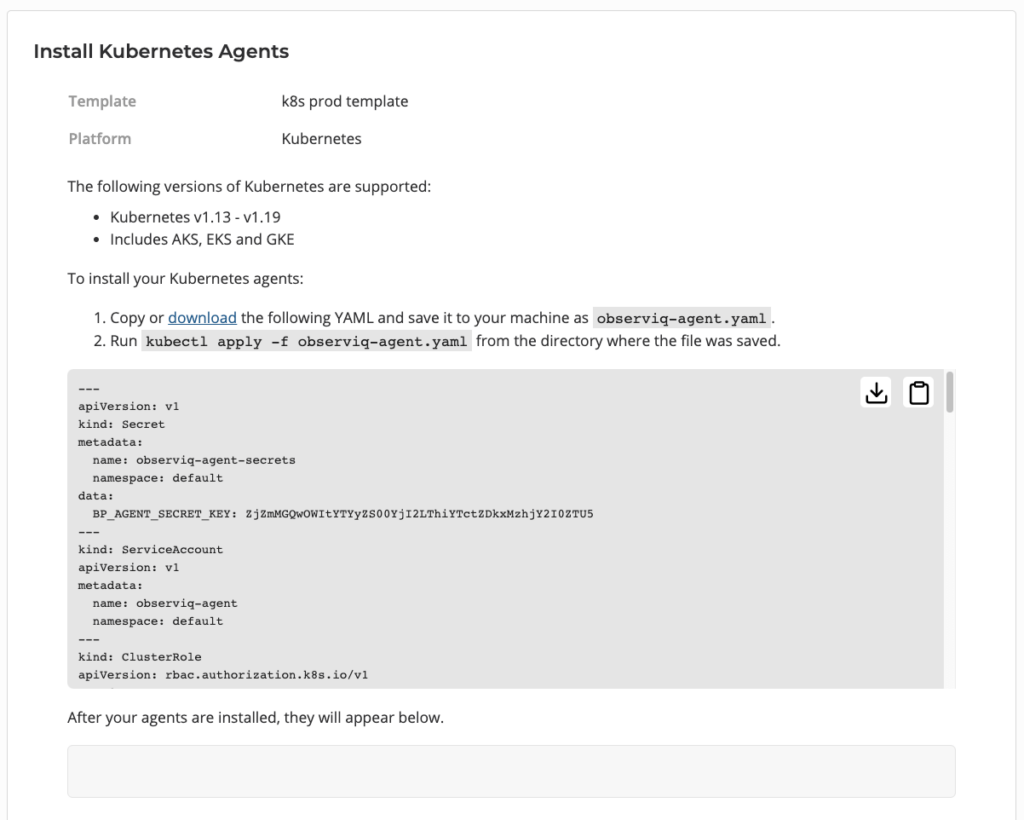
On the Install Kubernetes Agents page, download and copy the newly-generated observiq-agent.yaml to your cluster, and apply by running kubectl apply -f observiq-agent.yaml command. After 15-30 seconds, you’ll see the new Event Collector in the discovery panel below.
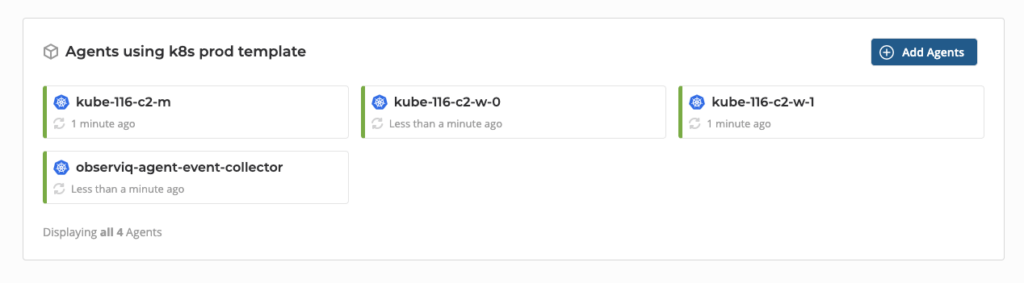
observIQ daemonset agents + event collector
View your Kubernetes Events in observIQ
After a few minutes, you’ll see Kubernetes Events on the observIQ Explore page. The messages will be typed as k8s.events.
Opening up one of the k8s.events, you can see parsed JSON objects and valuable labels and metadata that have been automatically added to the event to help correlate to a specific application.
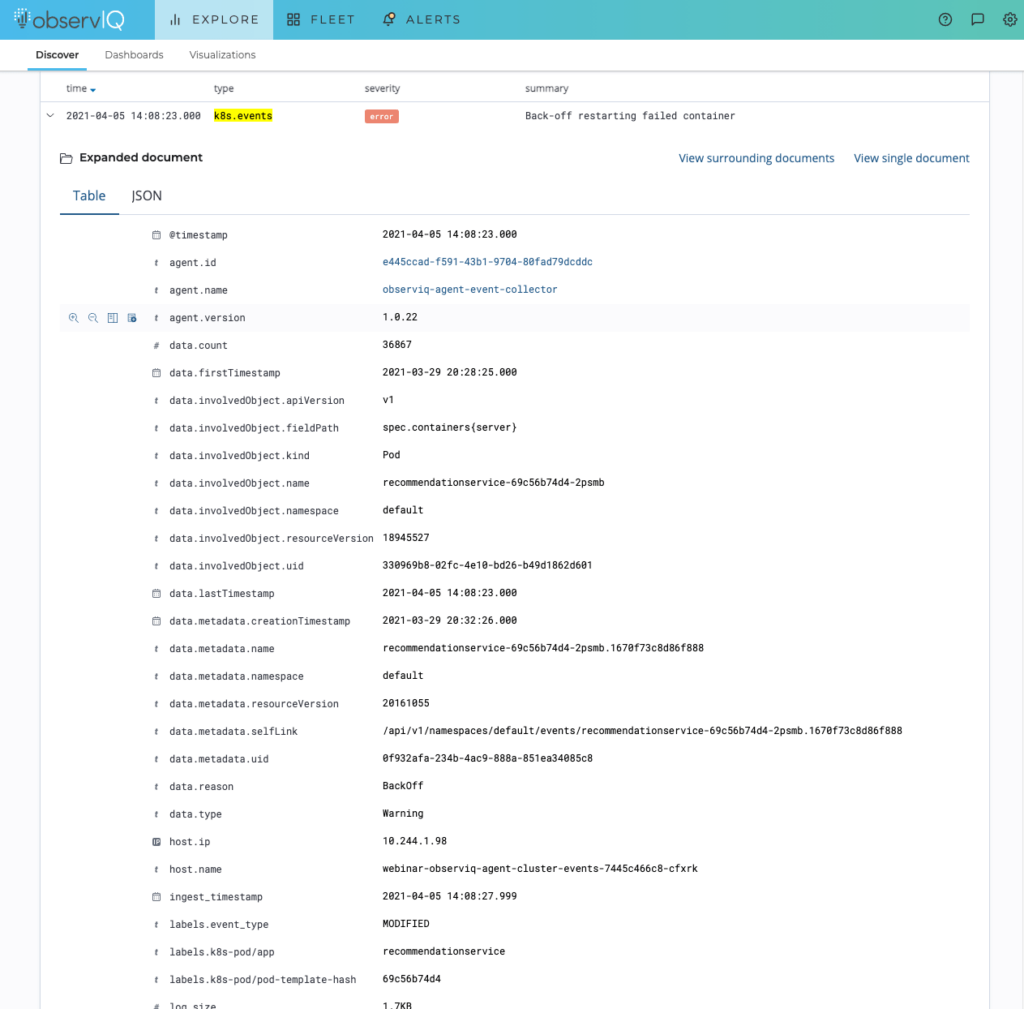
Kubernetes event in with Kubernetes Labels and Metadata
Wrapping up
Gathering your Kubernetes events is essential if you want a complete understanding of what’s going on in your cluster. Kubernetes Events are easily accessible with kubectl commands but are short-lived. Container logs and Kubernetes events can be correlated together – but it can be challenging without the right tool.
For a complete log management solution that will capture your Kubernetes Events, Container logs, and more, sign up here.


