OpenTelemetry in Production: A Primer
At observIQ, we’re big believers and contributors to the OpenTelemetry project. In 2023, we saw project awareness reach an all-time high as we attended tradeshows like KubeCon and Monitorama. The project’s benefits of flexibility, performance, and vendor agnosticism have been making their rounds; we’ve seen a groundswell of customer interest.
What is OpenTelemetry?
OpenTelemetry ("OTel") is a collection of standardized protocols, tools, and libraries that enable the collection, refinement, and transmittal of telemetry data (metrics, logs, traces, and events) from your applications or infrastructure.
It features over a hundred built-in integrations for popular technologies (Kubernetes, MySQL, Nginx, and many others). This lets you easily instrument your applications and infrastructure without writing custom code for each component.
Related Content: What is OpenTelemetry?
What isn’t OpenTelemtry?
The project does not include tools to derive meaning from your data (other than KPIs around collection and transmission). Instead, the project focuses on collection - leaving actionable insights to vendor platforms like Datadog, Google Cloud, and Splunk.
The project provides the tools to do it all from a telemetry standpoint but can be daunting without a primer. So, let’s jump into the why and then a bit of how you can evaluate if OTel is a good fit for your organization.
Why OpenTelemetry?
OTel offers a few critical benefits:
Standardization and simplification
A huge benefit to using OpenTelemetry is that it provides a single set of compatible, open-source tools that can gather all of the necessary signals to understand the state of your system or application. For those building and maintaining applications and systems: proprietary tools, agent fatigue, non-standard configuration, and performance issues are familiar challenges the project addresses directly.
Buy-in and Adoption
Nearly all major vendors support the project, making contributions that push forward the idea of vendor neutrality. Splunk, Datadog, New Relic, Google, Honeycomb, and observIQ (and many other organizations) have all contributed, rapidly accelerating the project over the last few years. You can find a nice breakdown of all the contributions here.
Vendor Neutrality
Lastly, and most importantly, OpenTelemetry enables vendor neutrality. This means you can instrument applications and infrastructure once and route your observability data to a back-end that best meets the needs of your business. From lowering costs and a more attractive feature set - whatever the reason may be, you can repoint your data with a simple configuration change (and rolled out en masse through BindPlane OP and standard DevOps toolchains such as Chef, Puppet, and Ansible).
If these benefits sound attractive to your organization, read on to understand how to take the next step with OTel in production.
Getting started
Taking an Inventory
To standardize telemetry collection for metrics, logs, and traces - you’ll need to take a high-level inventory of your tech stack, answering a few critical questions:
- What business-critical applications need to be observed in your environment?
- What programming languages are being used in your stack?
- What observability tools are you currently using in your stack?
- What signals are being collected, and how are they being collected?
- Where do you intend to send and analyze your telemetry data?
A high-level understanding of the answers to these questions will allow you to take the next step - mapping your organization's needs to specific OpenTelemetry components that facilitate telemetry collection, transformation, and delivery.
Familiarizing Yourself with OpenTelemetry
To map the necessary OTel components to your use case, taking the time to familiarize yourself with the project better is a worthy exercise, as there’s a fair amount to digest. To do so, I’d recommend taking a look at a few essential resources:
- The Official OpenTelemetry Demo provides an expansive environment demonstrating instrumentation and usage in a typical Kubernetes-backed microservices environment.
- OpenTelemetry Registry provides a searchable list of OpenTelemetry components, simplifying the OTel mapping process.
- Lastly, if you want to kick the tires and get an OTel collector up and running. Doing so will provide you with a guide and some context for what it’s like to configure a collector and start shipping telemetry data in about 10 minutes.
Related Content: How to Install and Configure an OpenTelemetry Collector
Selecting a Collector Distribution
Next, it’s important to know that several distributions of the OpenTelemetry Collector are available. Choosing one that aligns with your requirements is essential - but take comfort in knowing that the available configuration and components largely remain the same across distributions.
Here’s a quick breakdown of what’s available:
OpenTelemetry Collector Contrib
This distribution includes the most components (receivers, processors, exporters) and is where you find the newest components that have not yet made it into the OpenTelemetry Collector Core repository. Generally, this is the right place to start if you want to test the waters with a sandbox collector, but it may include more stuff than you need when you’re ready to deploy to production.
OpenTelemetry Collector Core
This distribution includes a minimal, hardened set of components. We typically don’t recommend it for production environments, as core is not expansive enough (yet) to address some of the most common use cases we work with customers on a day-to-day basis.
Vendor Distributions
As the name implies, vendor distributions are built and managed by a specific vendor. It’s important to know that these distributions can include components specific to the vendor’s platform, resulting in unnecessary vendor lock-in. If you’re considering a vendor distribution, inquire about functionality specific to the distribution to understand the impact of moving away from the distribution in the future.
One advantage of vendor distribution is that they often include support as a primary benefit, providing an SLA, which can often be required for large organizations.
It’s also helpful to know that observIQ offers a supported distribution. It includes support for OpAMP enabling remote agent and OTel configuration management with BindPlane OP.
Building your own OTel Collector
Lastly, building your collector distro is an option as well. With the OpenTelemetry Collector Builder, you can build a distro that only includes the necessary components - minimizing unnecessary bloat and simplifying configuration. Also, stating the obvious - these distributions are often self-supported and maintained.
Deployment Patterns
Next, let’s take a look at some common deployment patterns. These are typical patterns we’ve seen in the field - but are flexible enough to scale with any environment.
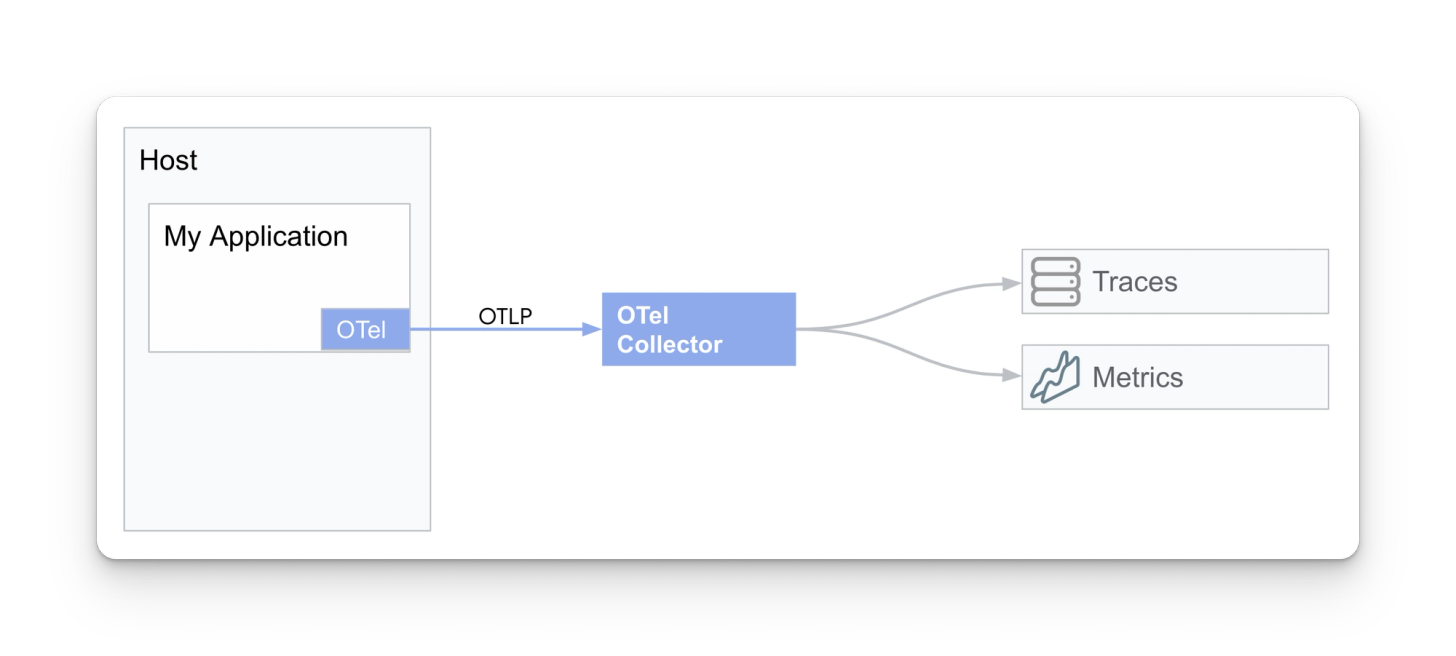
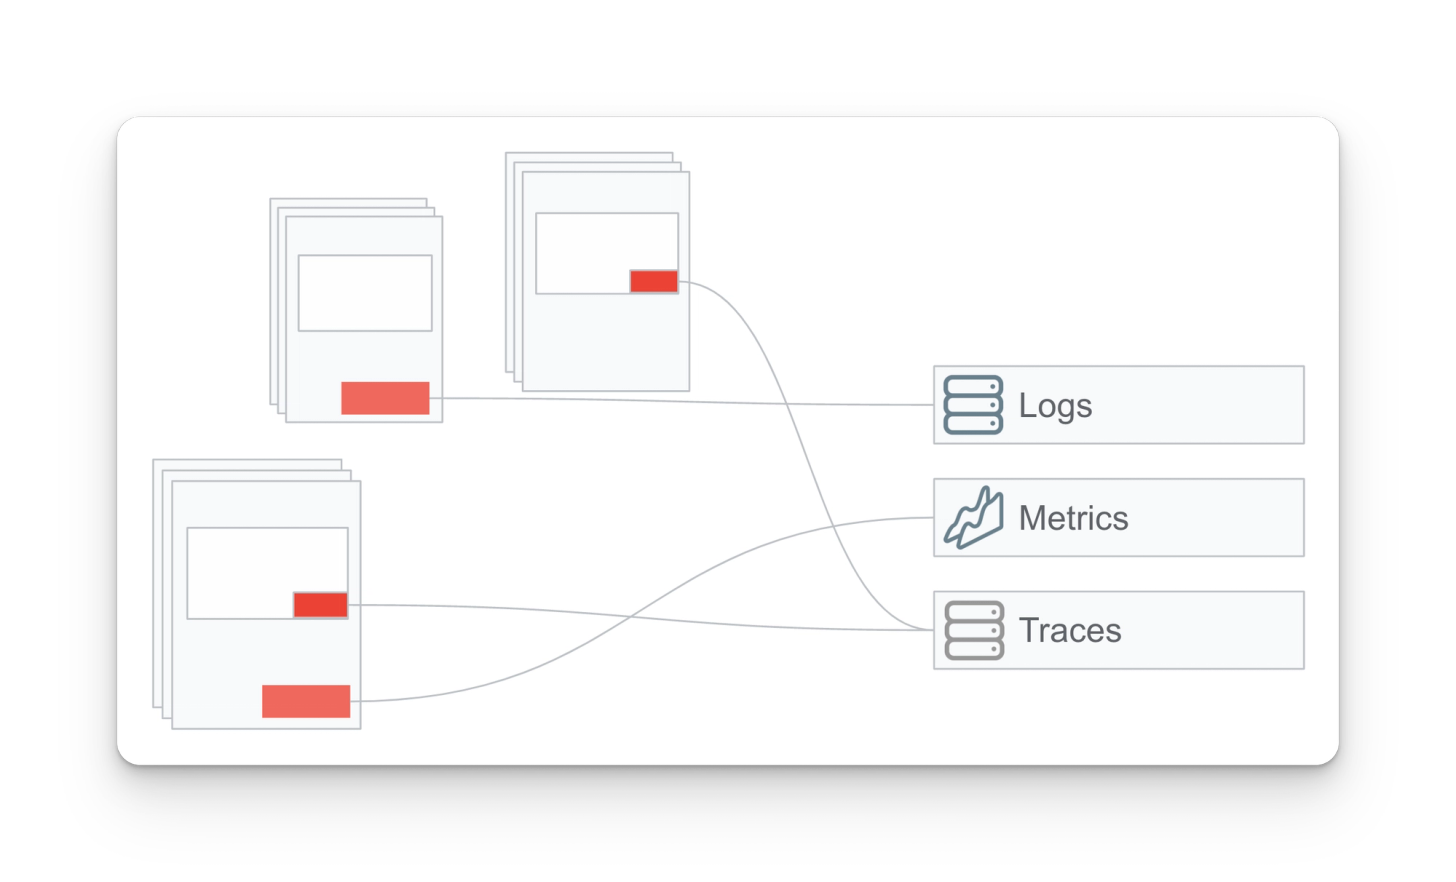
Instrument app ⇒ gather with an OTel collector (separate host)
In this pattern, a custom application has been instrumented to expose OTLP metrics and traces gathered by a collector running on a separate host.
This pattern has a few pros and cons:
- Pros
- It’s a simple pattern, providing a 1:1 mapping between an application and a collector
- Mitigates risk by deploying the collector to a host separate from your application
- Putting a collector in between your instrumentation and backend allows you to easily filter and reroute your data without modifying your app infrastructure
- Cons
- 1:1 application-to-collector ratio doesn’t scale for larger workloads
- If the collector is deployed on a separate host from the application, it’s unable to gather host metrics and log data, missing out on some telemetry that could be used for root cause analysis
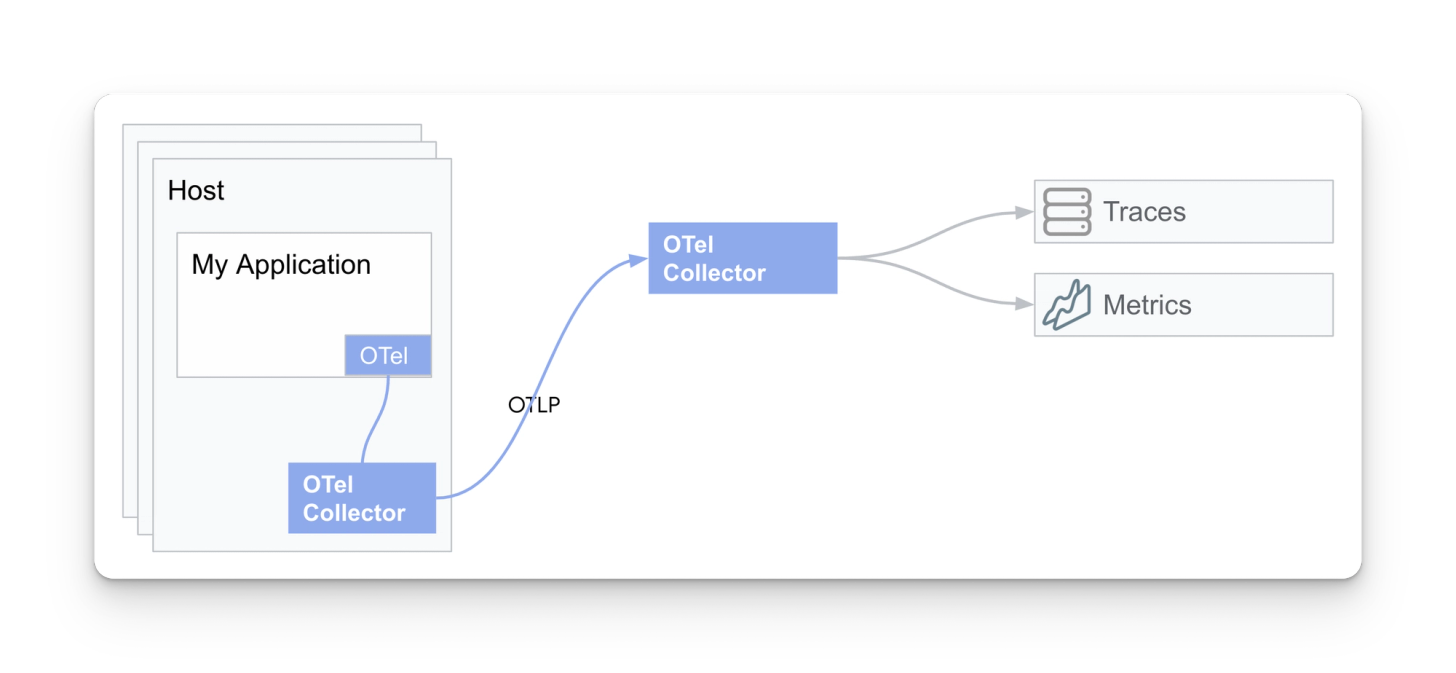
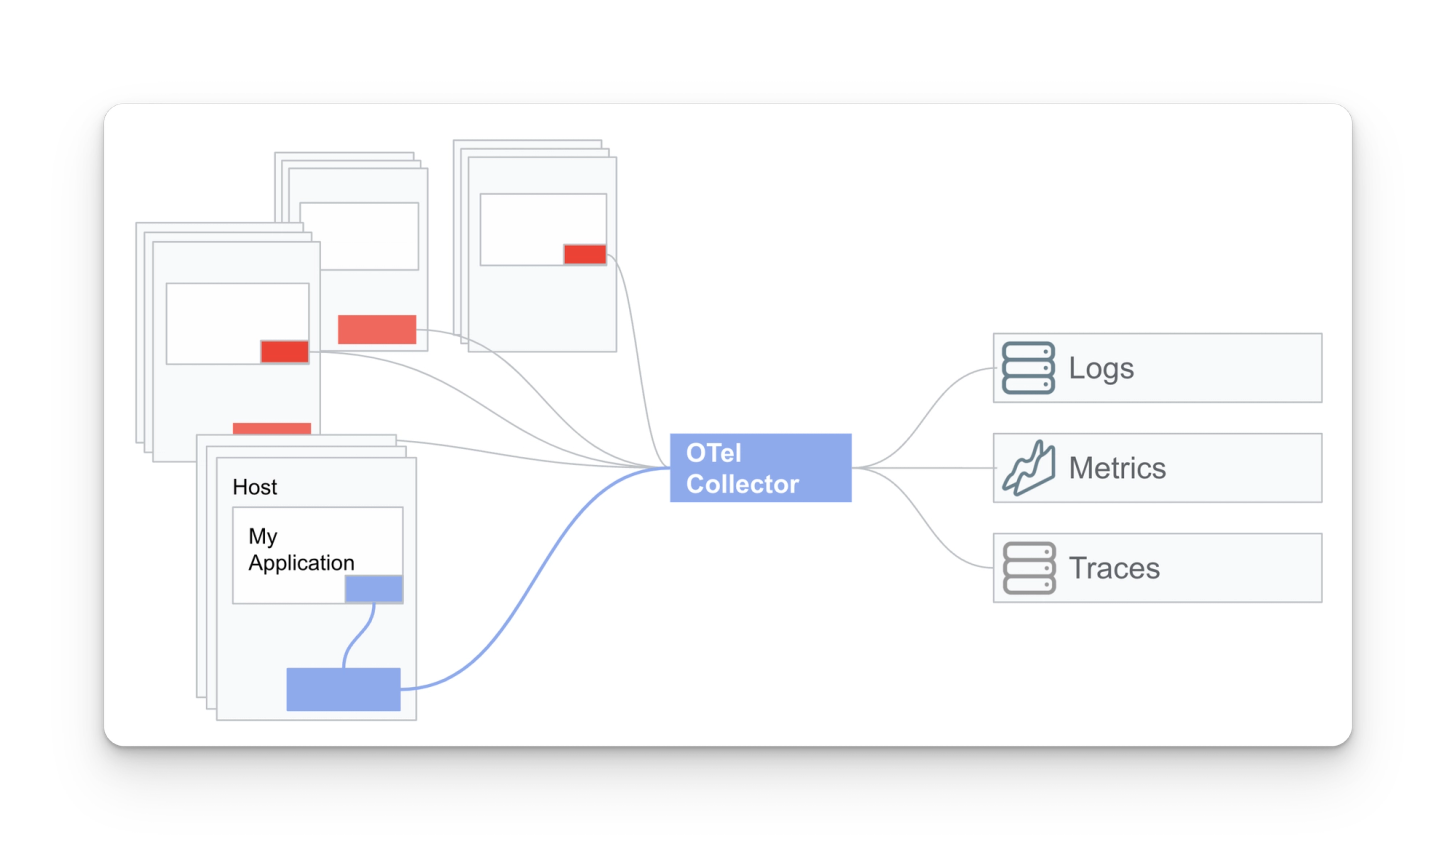
Instrument app ⇒ OTel collector (same host)
In this pattern, a custom application has been instrumented to expose OTLP-compatible metric, log, and trace data gathered by a collector running on the same host.
- Pros
- Deploying a collector locally for log and metric collection from the node/host, in addition to gathering the application-specific telemetry, providing a complete picture of your application and host it’s running on for root cause analysis
- Cons
- May require an infrastructure change if there are not any agents or collectors deployed in your environment
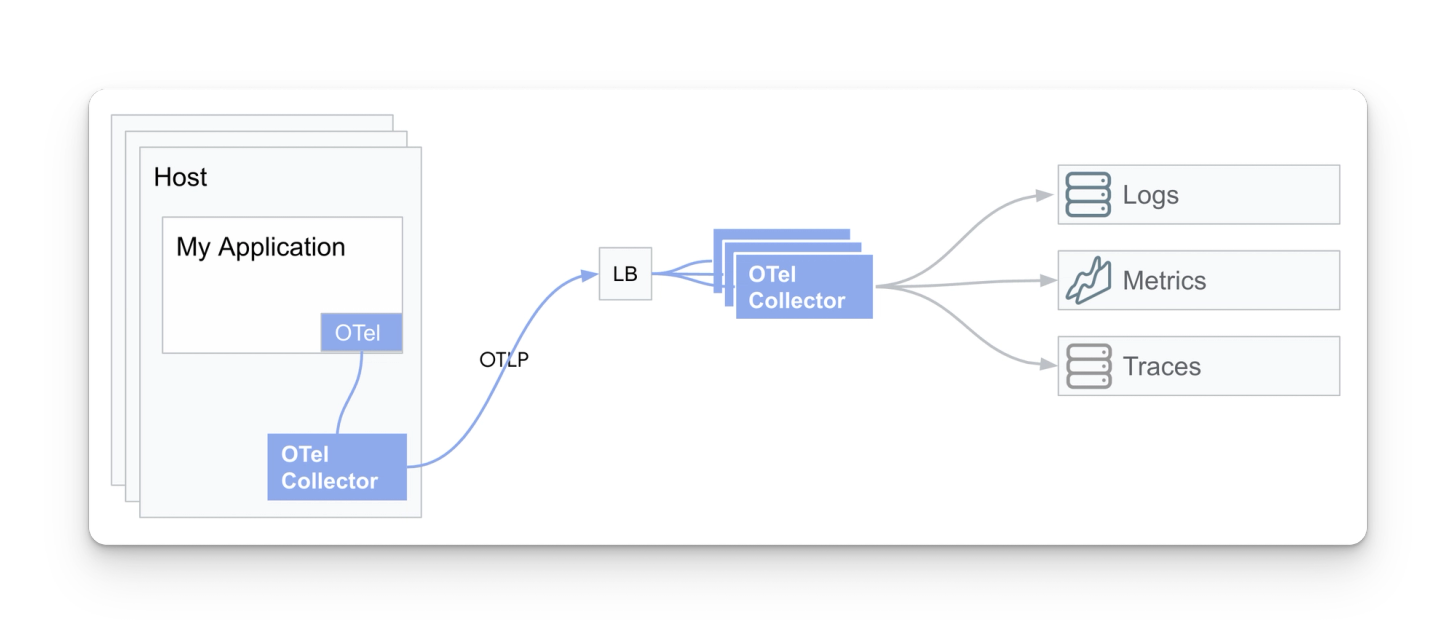
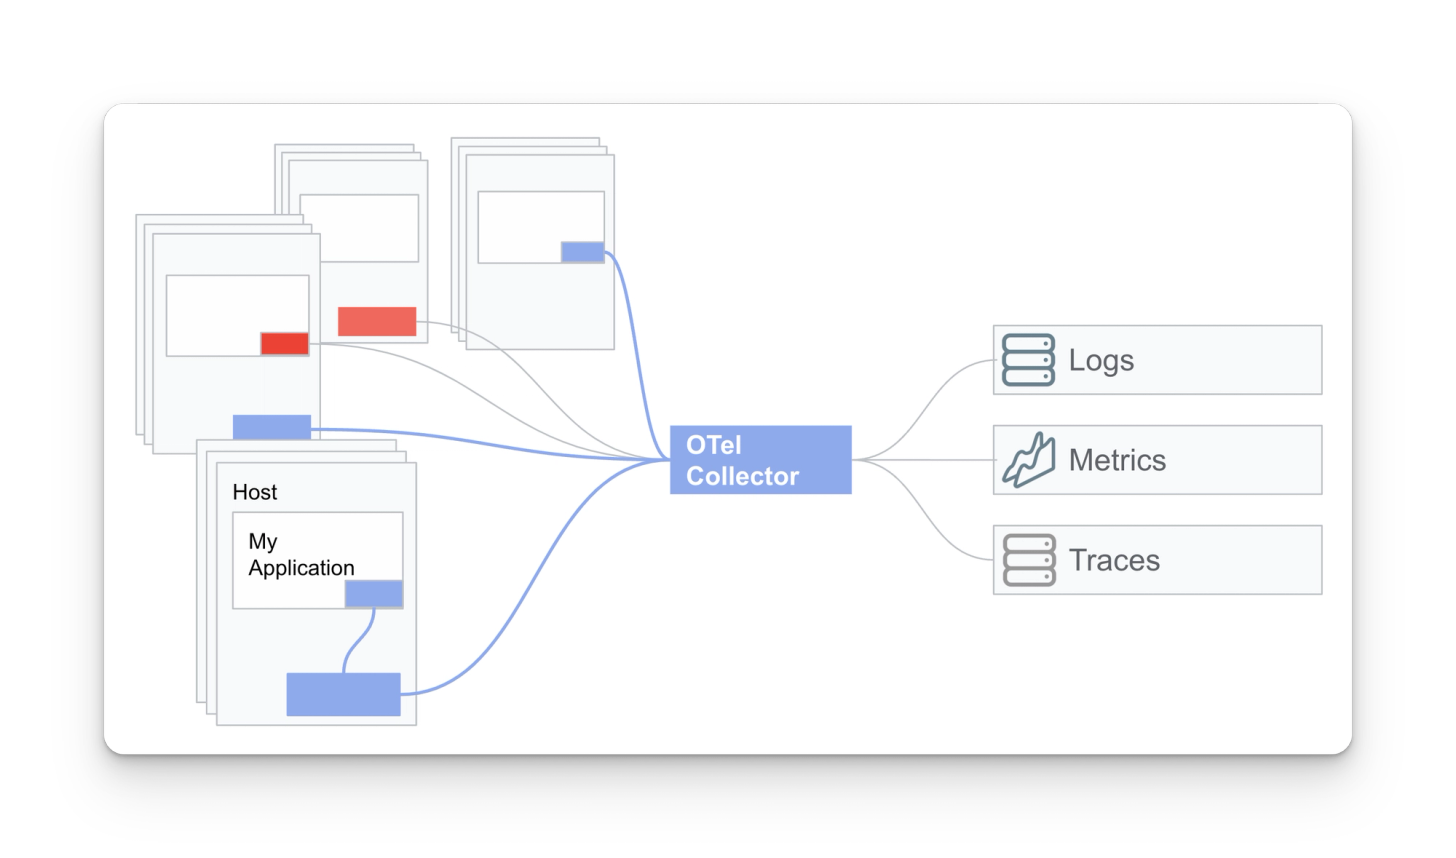
Instrument app ⇒ OTel collector (same host) ⇒ load balancer ⇒ collector group
In this pattern, a collector has been deployed to the same host as the application. The collector is forwarding its data to a group of collectors behind a load balancer.
- Pros
- Scaling and redundancy when dealing with large amounts of telemetry data or high processing needs
- Cons
- More complexity when the data volume is low
Requires separate tooling/hardware to yield desired scalability redundancy
- More complexity when the data volume is low
Instrument app ⇒ OTel collector (same host) ⇒ collector gateway
Lastly, in this pattern, collectors have been deployed in this environment to act as gateways, which allow telemetry to be aggregated before reaching an observability backend.
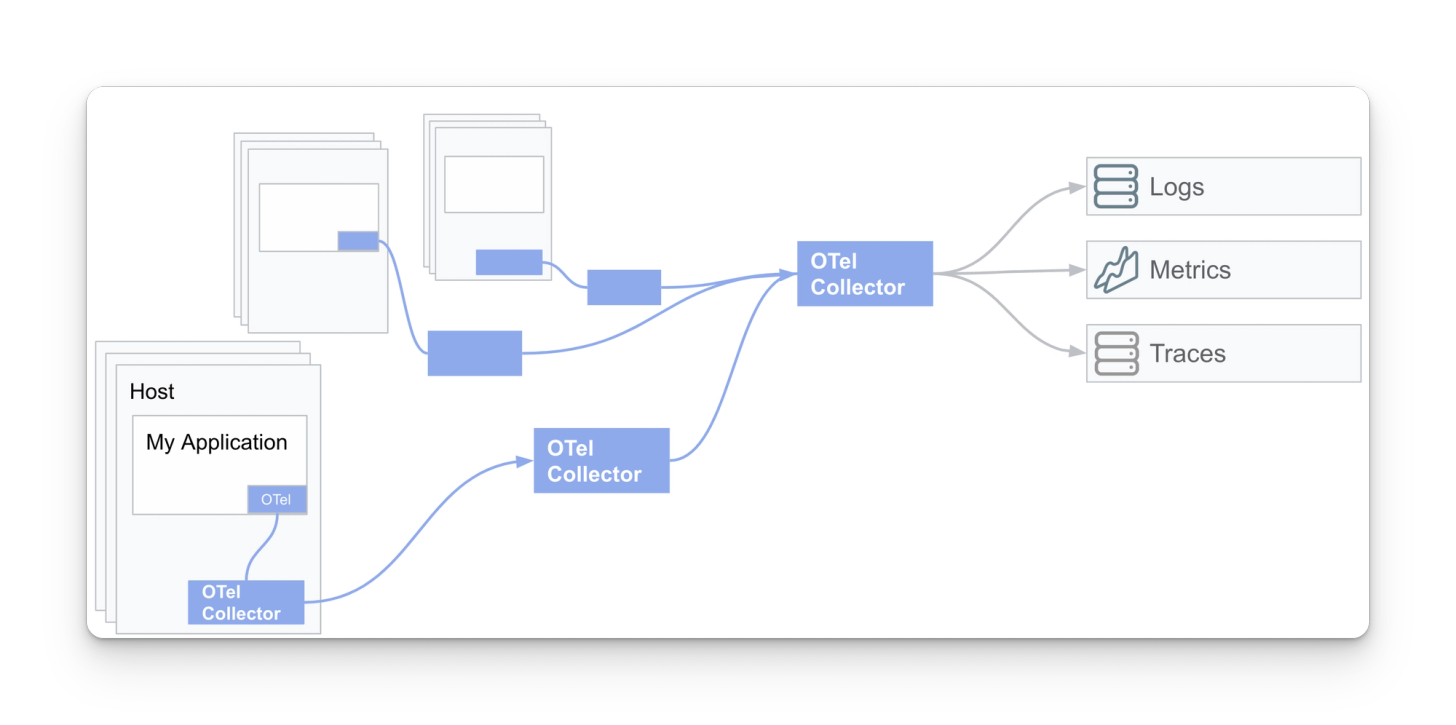
- Pros
- Highly scalable data plane standardized on OpenTelemetry.
- Easy to add new destinations with access to any/all of your telemetry data. No need to re-instrument with vendor agents/SDKs
- By aggregating telemetry with a gateway, a user can refine the data at a central point in the pipeline
The observability pipeline is shifted further away from a specific vendor
Migrating to OpenTelemtry
Next, let’s talk about migration. Most organizations have large, already-existing deployments with proprietary instrumentation and agents. Thus, we typically recommend migrating to OpenTelemetry in a phased process. High-level breakdown below:
Phase 1: Greenfield OTel deployment
We recommend using OpenTelemetry in greenfield deployments -- working with a clean slate in a PoC environment to minimize noise and risk. It enables customers to see the value of OpenTelemetry quickly.
Phase 2: Redirect existing agents using OTel
Once you’ve successfully tested OTel in your greenfield environment, you can repoint your existing agents to OTel collectors. It is critical to know that FluentD, Fluent Bit, Splunk agents, and more can have their output redirected (or duplicated) to OpenTelemetry collectors.
Phase 3: Replace existing agents with OTel Collectors
The last phase is replacing your existing instrumentation with OTel instrumentation. Replacing your observability stack with pure OTel is not required but recommended when available.
If you’re considering, have questions, or want to chat about OTel in production, contact us at info@observiq.com. Thanks for reading!


