Enhancing Data Ingestion: OpenTelemetry & Linux CLI Tools Mastery

While OpenTelemetry (OTel) supports a wide variety of data sources and is constantly evolving to add more, there are still many data sources for which no receiver exists. Thankfully, OTel contains receivers that accept raw data over a TCP or UDP connection. This blog unveils how to leverage Linux Command Line Interface (CLI) tools, creating efficient data pipelines for ingestion through OTel's TCP receiver.
Prerequisites
- One or more data sources that OTel does not natively support
- This will currently only work for logs or metrics that can be ingested as logs and converted to metrics in the OTel pipeline.
- One or more systems with the BindPlane OpenTelemetry Collector on which we will apply a configuration that includes a TCP Source
- Appropriate firewall rules for the chosen TCP port to allow incoming connections
- It can be a Gateway set of collectors behind a load balancer.
- A Linux system that either has or can have added all the CLI tools needed for a particular use case
- Some commonly used tools are netcat (aka nc, this one is required!), curl, jq, awk, grep, head, tail, date, and cut.
Leveraging Linux (Or UNIX) CLI for Optimization
Linux command line (CLI) utilities are the tools of choice for processing and transmitting data. I will illustrate the required tools (netcat, jq) and several additional tools that can help format the data properly before sending it.
Netcat
The first tool we will look at is called Netcat. Most Linux distributions have the actual binary in the short form of nc. Netcat is a tool that lets you read from and write to network interfaces. We will use it to write to a port the collector listens on using the TCP Source. The syntax we will be using is straightforward:
command chain | nc localhost 7777
The above is an abbreviated sample with a command chain that ends with piping the output to Netcat. Netcat is sending it to localhost on port 7777. These are simply what I have chosen.
jq
Another tool that isn’t required for every data set but is for many of them is called jq. This tool is a lightweight JSON processor. The most common use for jq is to print JSON files pretty. However, for our use case, we will be using it to format the data so that each single record within the JSON is on one line. For example, we can format data that is in pretty print already back to one record per line and pipe it to Netcat as discussed above:
command chain | jq -c '.[]' | nc localhost 7777
This will take a command chain that gets the data, such as using curl against an API endpoint, pipe it to jq for formatting, and then pipes it to netcat to send to the collector.
Combining Tools for Enhanced Ingestion
Other tools can be handy. For the sake of brevity, these will be very basic examples. I will also not cover every single possible tool. Linux has so many great CLI utilities that can be beneficial to data manipulation that a 400+ page book would be required to cover them all in all possible iterations thoroughly.
Head and Tail
First, a quick look at the head and tail utilities. Head is a tool that returns several lines from the start of a file (or data stream). If you specify a number prefixed with a - symbol, it will instead trim that many lines off the end of the output. Tail is the opposite in that it returns lines from the end of a file. If you pass it a number prefixed with a + symbol, it will start from that file line (or data stream) instead. This is useful for removing a file's header and/or footer. For example, to remove a 5-line footer and a 25-line header from a JSON file: head -n -5 sample.json | tail -n +26 | jq -c ‘.[]’ | nc localhostIn the example, we specify -5 for head to drop the last five lines of the file. Then, we specify +26 to tail to drop the file's first 25 lines (we specify the line we want to start on). Finally, we pass it on to jq and netcat as in the previous examples.
Date
If our data doesn’t have a timestamp on it, we can manually add one. The OTel collector can also do this via its “observedTimestamp” field. However, there are often reasons to add a timestamp before reaching the collector. I’ll be using echo and xargs in this contrived example.
command chain | xargs -I{} echo "$(date +%FT%TZ) {}" | nc localhost 7777
This time, we have a command chain to gather the data. Then we iterate through each line of the data using xargs and use echo to prefix them with a date in the format of %FT%TZ, which can also be illustrated as YYYY-MM-DDTHH:MM:SSZ and looks like this: 2024-03-27T12:02:56Z. After prepending the data with the date (what a mouthful), we will send it to our collector via Netcat again.
Curl
Curl is a common tool for retrieval of data from a remote server. This can be used to retrieve data from an API. Our example here is very straightforward:
curl remote.host.test:5580 | jq -c '.[]' | nc localhost 7777
As we’ve just built on our previous jq example using curl as the “command chain.” Curl reaches out, gets the data, pipes it to jq, which formats it, and finally pipes it to Netcat to be sent to the collector.
Data Ingestion Via TCP Source
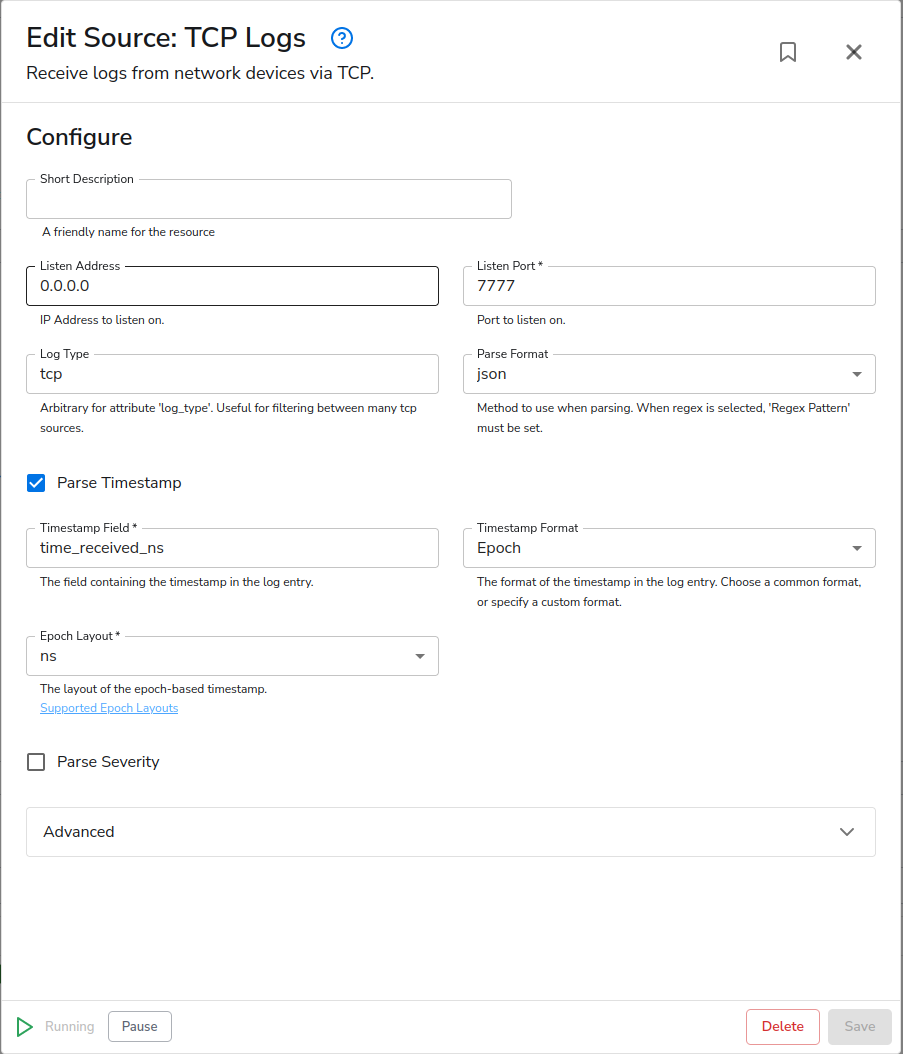
In the previous section, I referred several times to sending the data to the collector. Our configuration to support this is a simple TCP logs receiver. I’ve configured it to listen on all interfaces and port 7777.
Related Content: How to Manage Sensitive Log Data
An End-to-End Example: NetFlow Data
We have discussed the theory and general principle of using Linux CLI tools to massage our data into a format we can efficiently work with inside the OTel Pipeline. Now, I would like to use those principles to build a real-world example. A requirement of this example is a utility called glowflow2. I have an open request to turn goflow2 into an actual receiver (source); however, until that exists, I still need to ingest my NetFlow, sFlow, and IPFIX data.
My command line looks like this: goflow2 | nc localhost 7777
Which uses the default ports of 2055 for NetFlow and IPFIX and 6343 for sFlow. It then pipes it to Netcat, connecting to localhost 7777, where the above TCP source is already running.
$ goflow2 | nc localhost 7777
INFO[0000] starting GoFlow2
INFO[0000] starting collection blocking=false count=1 hostname= port=6343 queue_size=1000000 scheme=sflow workers=2
INFO[0000] starting collection blocking=false count=1 hostname= port=2055 queue_size=1000000 scheme=netflow workers=2
Now, I’ve edited the TCP source to make a few changes. First, I changed the Log Type to “goflow2”. The timestamp parsing was already set to Epoch and ns (nanoseconds) in preparation for this. Lastly, I added a short description: “goflow2 NetFlow/sFlow/IPFIX”.
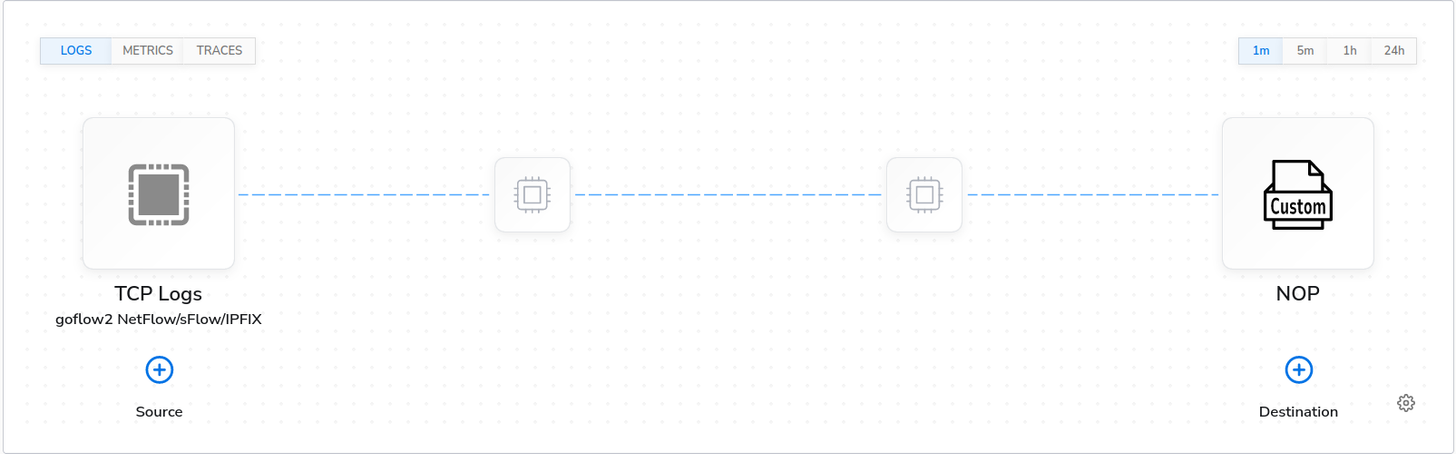
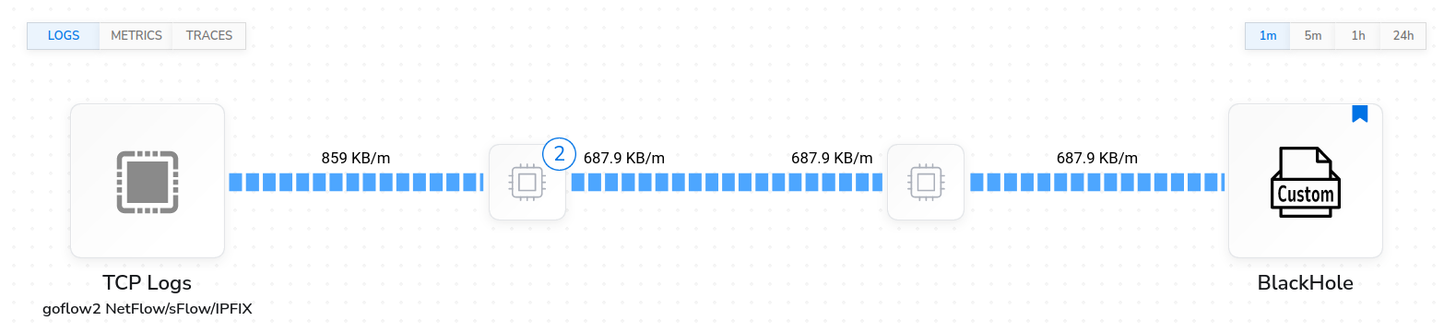
For testing purposes, I’m sending to a custom “nop” destination (No Output/No Operation) that drops the data into the ether. My pipeline currently looks like this:
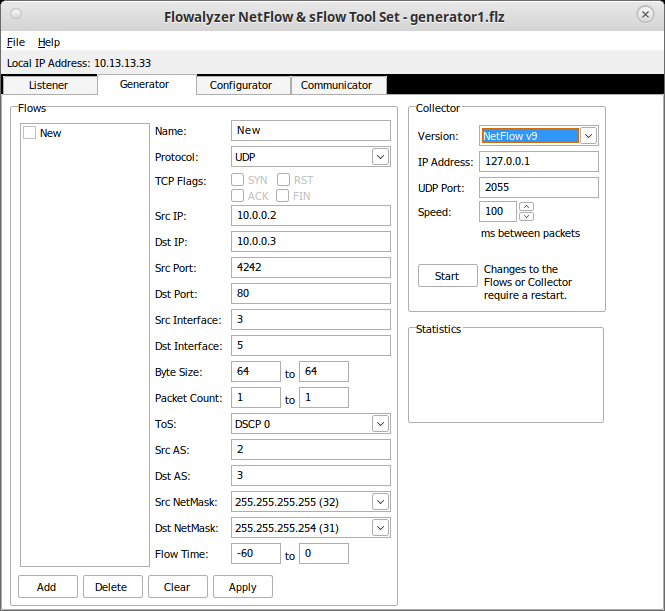
The next step involves connecting up a data source on the input side of goflow2. For the purpose of this blog, I’m using a data generation tool called Flowalyzer that supports NetFlow v5, NetFlow v9, and IPFIX. It is a Windows tool, but lucky for me, it runs just fine under Linux using Wine! I’ve configured it to send NetFlow v9 data. This is what it looks like:
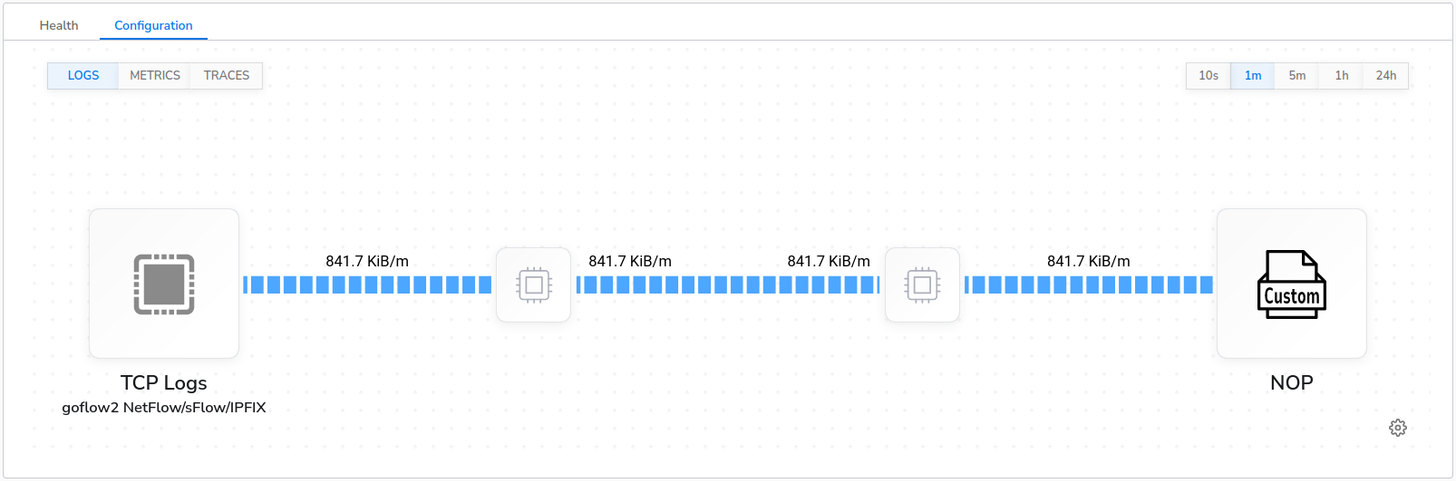
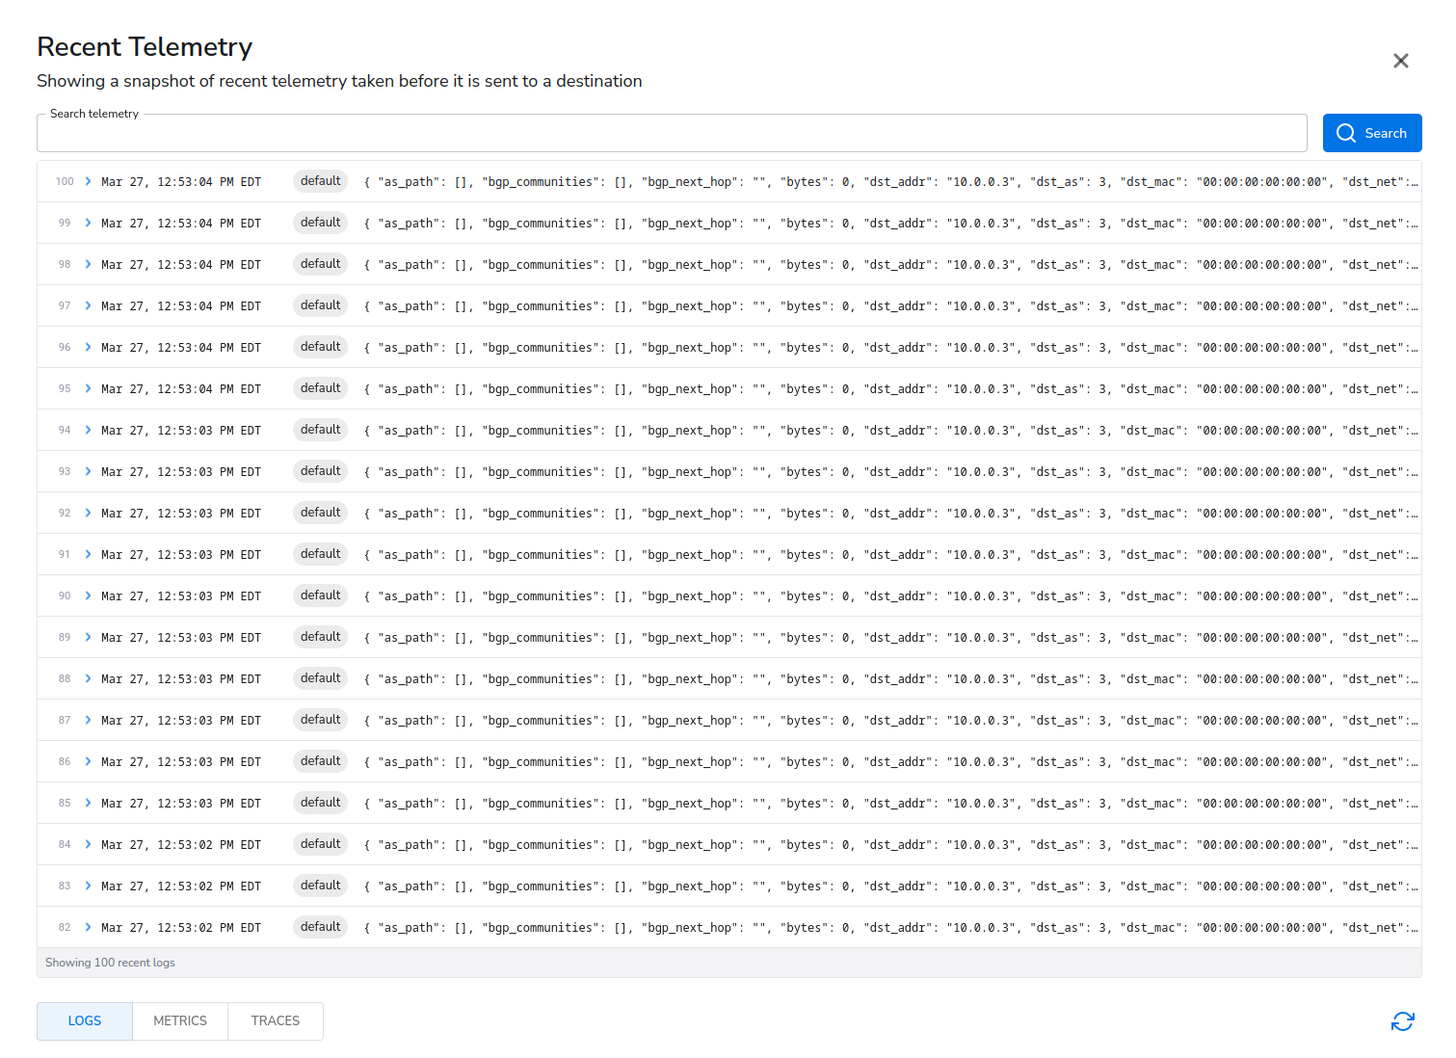
After clicking “Start” and letting it run for a bit, I have the following data flow and recent telemetry:
Using Processors to Reduce, Enhance, or Convert Data
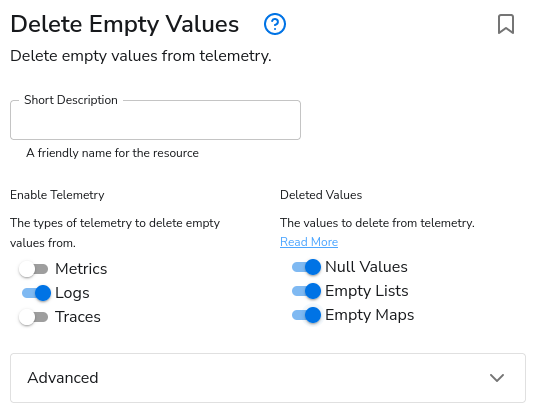
Now that we have data flowing, we should take advantage of the data reduction, enhancement, and conversion capabilities offered by BindPlane. Right away, after looking at the data, I see an easy reduction option. In my test data, as_path, bgp_communities, and bgp_next_hop are all empty maps or strings. I only want data if it isn’t empty, so I will put in a Delete Empty Values processor to filter those out.
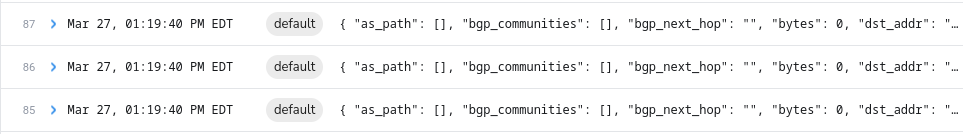
Before Processor.
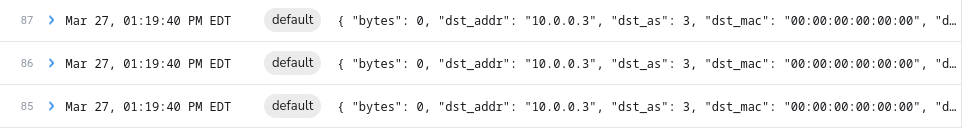
After Processor.
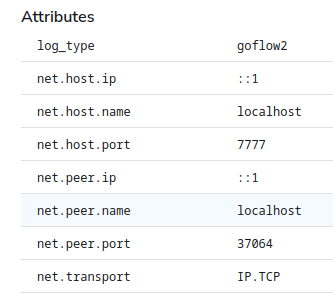
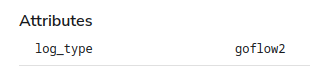
Under attributes is a bunch of net information irrelevant to our actual log. It is the network information related to the connection from Netcat to OTel’s TCP source. Thus, I will drop those by using the Delete Fields processor.
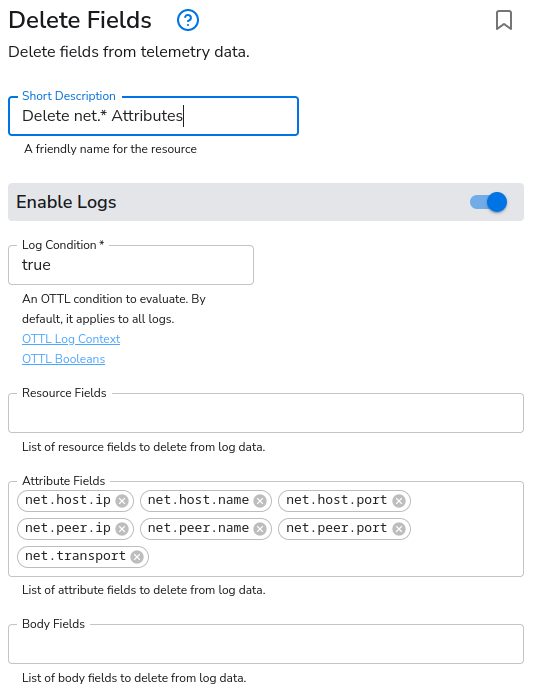
Before and after of the Attributes.
Making these two simple reductions reduces our data by about 20-25% with the sample data I’m generating with Flowalyzer.
With some creativity and the right set of tools, logs from almost any source can be piped into an OTel collector using the TCP source. Those logs can be parsed and manipulated just like any other source. Many tools are useful, especially on Linux. However, as shown, some Windows tools can be used as well. If you’re struggling with a set of data from a strange source, have a sit down with your local Linux guru, this blog, and get creative! I’m confident a solution can be found, just as I did with my NetFlow use case.
Related Content: Turning Logs into Metrics with OpenTelemetry and BindPlane OP
As I wrote my conclusion, I noticed that my NetFlow data had stopped coming through. A quick investigation reminded me that Netcat doesn’t handle dropped connections well. A collector restart for my config change had caused a “broken pipe” (Ncat: Broken pipe.). So, I’ve made use of Linux capabilities a little further and solved it by wrapping the Netcat portion in an infinite loop that keeps restarting it every time it shuts itself down:
goflow2 | while true; do nc localhost 7777; done
Just to reinforce that there is always a way. Okay, maybe not always, but almost always.


