Exploring & Remediating Consumption Costs with Google Billing and BindPlane OP

We’ve all been surprised by our cloud monitoring bill at one time or another. If you are a BindPlane OP customer ingesting Host Metrics into Google Cloud Monitoring, you may be wondering which metrics are impacting your bill the most. You may have metrics enabled that aren’t crucial to your business, driving unnecessary costs. How do we verify that and remediate?
Using Metrics Explorer and BindPlane OP, you can find metrics that are using the most consumption and turn them off in your BindPlane OP configuration to save on your cloud bill. In this blog, we’ll show you how to do just that.
Tracking down costs in Google Cloud Platform
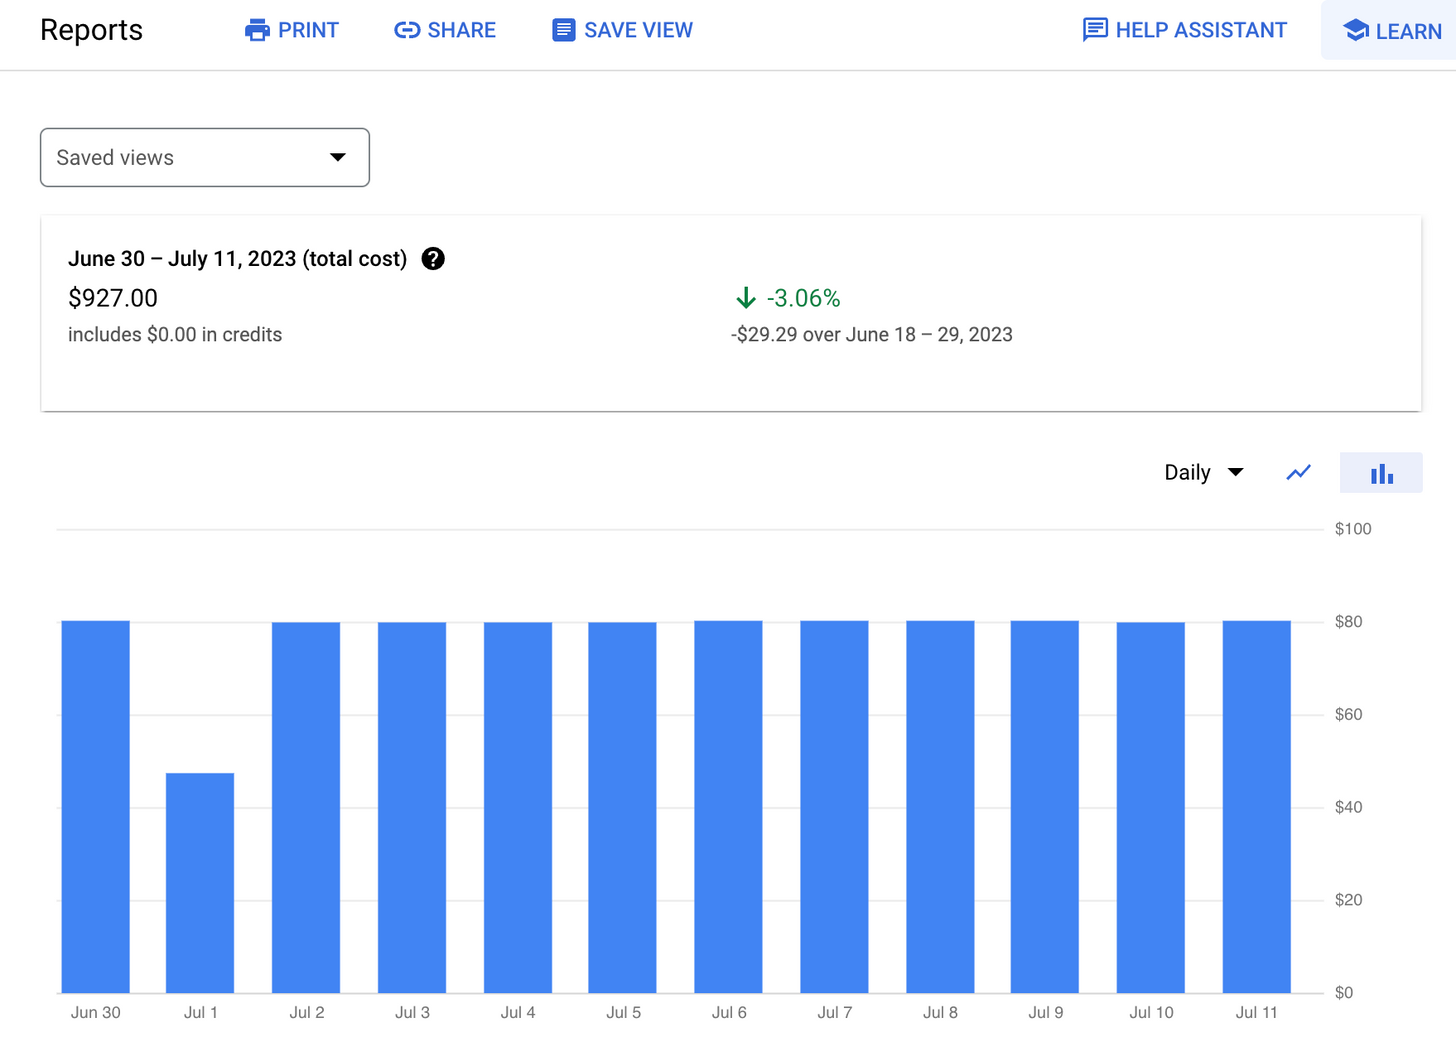
What are we being charged by Google? In the report below, we can see the daily cost. To run the report, perform the following steps:
- Go to the Google Cloud Console.
- Search for “reports” in the search bar at the top of the screen.
- Click on “Reports - Billing”
- Choose the appropriate billing account to view.
- After selecting the billing account, you’ll see a list of filters to apply on the right side.
- Under Month, choose “Last Month” or “Current Month”, or pick a custom range.
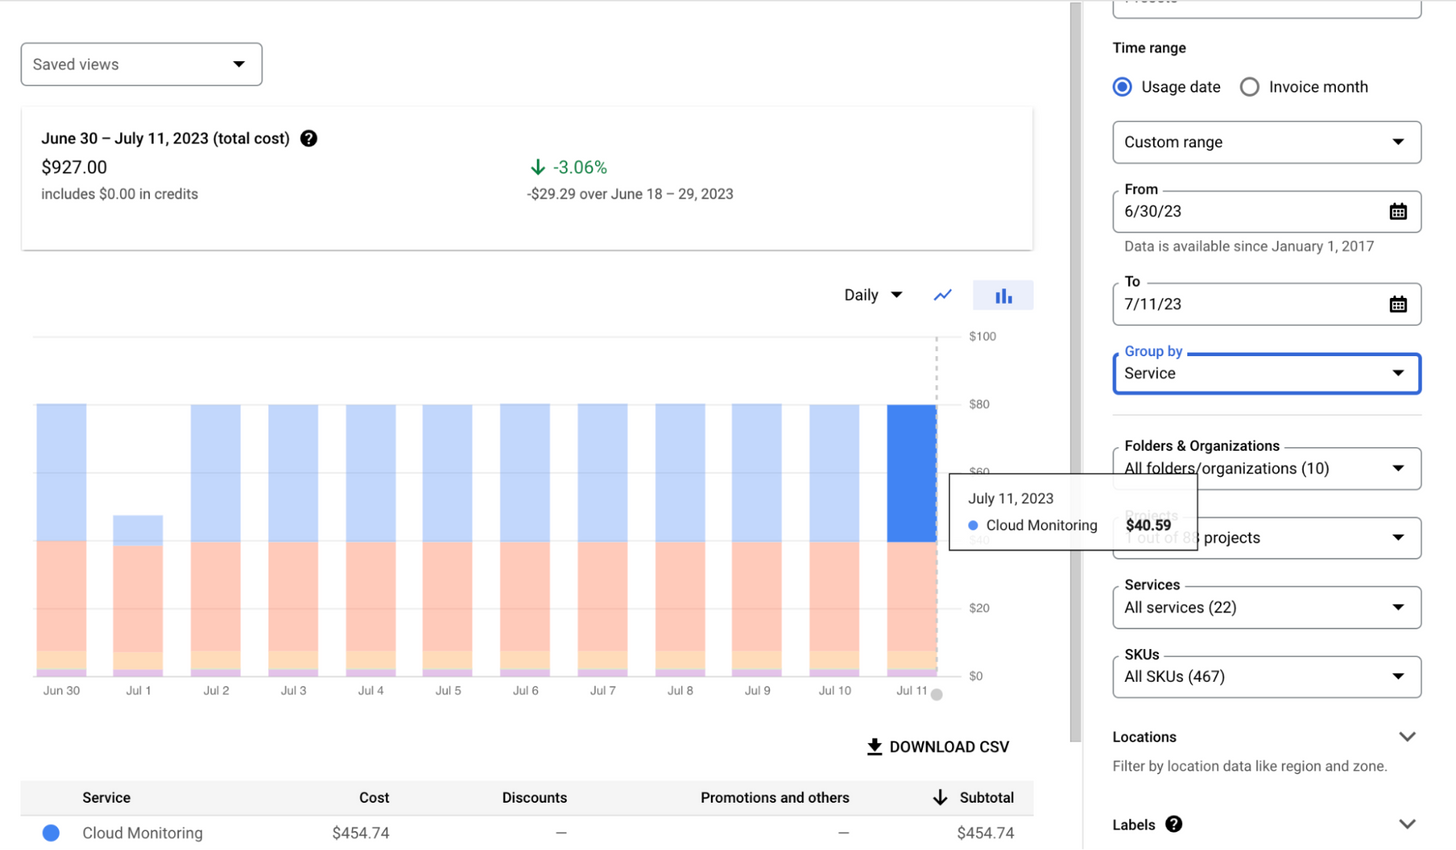
- Under “Group By” select “Service”
- Under “Projects,” choose the project where your metrics are routed.
- Under “Services,” select “Cloud Monitoring.”
Now, you will have a view of all the monitoring charges from BindPlane OP metrics ingestion to Cloud Monitoring. In our example report, we can see that Google Cloud Monitoring expenses come to about ~$40 a day.
In this report, we can perform a breakdown by service to what is driving the numbers. Nearly half of that is Google Cloud Monitoring expenses. ~$40 a day.
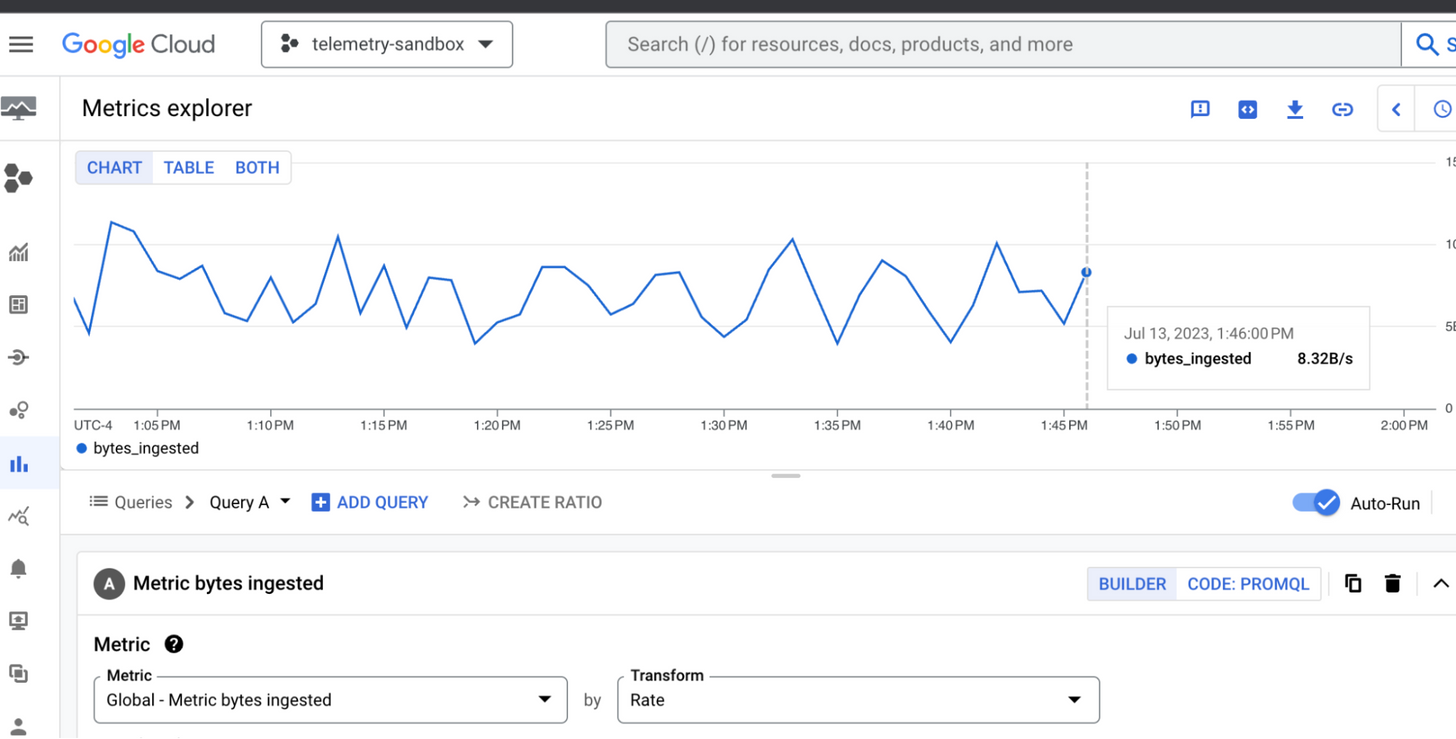
Now, going to Google Cloud monitoring, we can track down what exact metrics are driving the costs.
- Search Metrics Explorer in the search bar and select it.
- Select the appropriate project in the top left.
- Under “Select a Metric” type in “Billing”
- In the dropdown choose Global > Billing > Metric bytes ingested.
The metrics bytes ingested will have consumption used by different metrics namespaces within cloud operations.

1) Delete the Group by filter to allow for looking at individual metric namespaces.
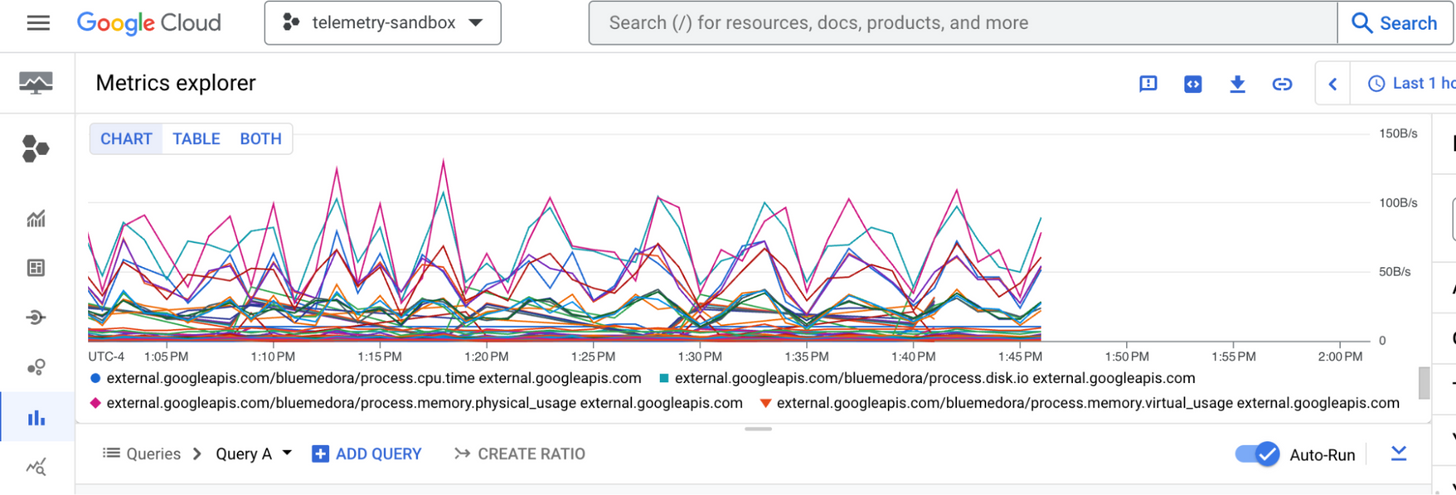
2) Use the table view and sort by b/s value to find the metric that is using the most consumption.

3) You can trace this to the host where this data is coming from, by looking at the node_id or hostname of the metrics.
Remediation in BindPlane OP.
Now that you know which host metric is driving the most consumption, you can find the agent in BindPlane that matches that hostname, and turn it off to see the impact.
1. Click on the agent in question from the agents tab.
2. Click on the associated configuration.
3. Edit a New Configuration.
4. Select the Host Source.
5. Deselect “process.cpu.utilization. (see image)
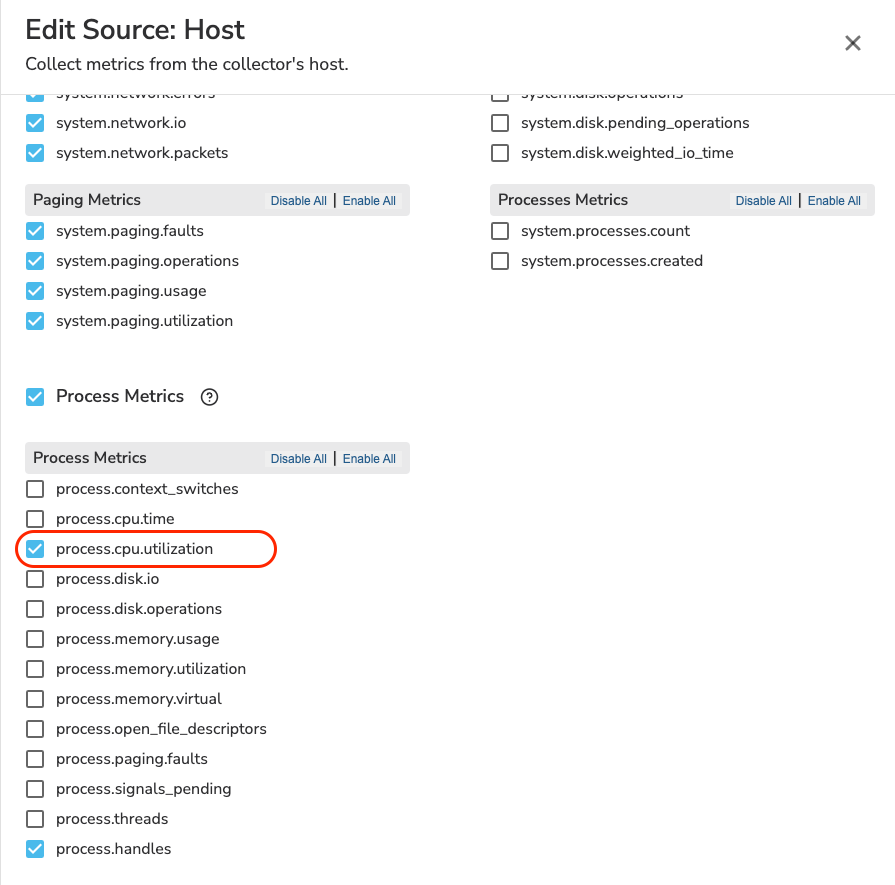
6. Click Save
7. Click rollout to apply those changes to the agent.

After making these changes, you should notice a drop in your daily consumption, and associated charges in your cloud bill. For questions, requests, and suggestions, reach out to us or join our community slack channel.