Filtering Metrics with the observIQ Distro for OpenTelemetry Collector

This post will address the common monitoring use case of filtering metrics within observIQ’s OpenTelemetry (OTEL) Collector distribution. Whether the metrics are deemed unnecessary or filtered for security concerns, the process is straightforward.
We will use MySQL on Red Hat Enterprise Linux 8 for our sample environment. The destination exporter will be to Google Cloud Operations, but the process is exporter agnostic. We use this exporter to provide visual charts showing the metrics before and after filtering.
Environment Prerequisites
- Suitable operating system
- observIQ Distro for OTEL Collector installed
- MySQL installed
- MySQL Least Privilege User (LPU) setup
- OTEL is configured to collect metrics from MySQL
Resources
- observIQ Distro for OTEL Collector Download
- MySQL Receiver Documentation
- MySQL Metadata File (Lists the Metrics)
Initial Metrics
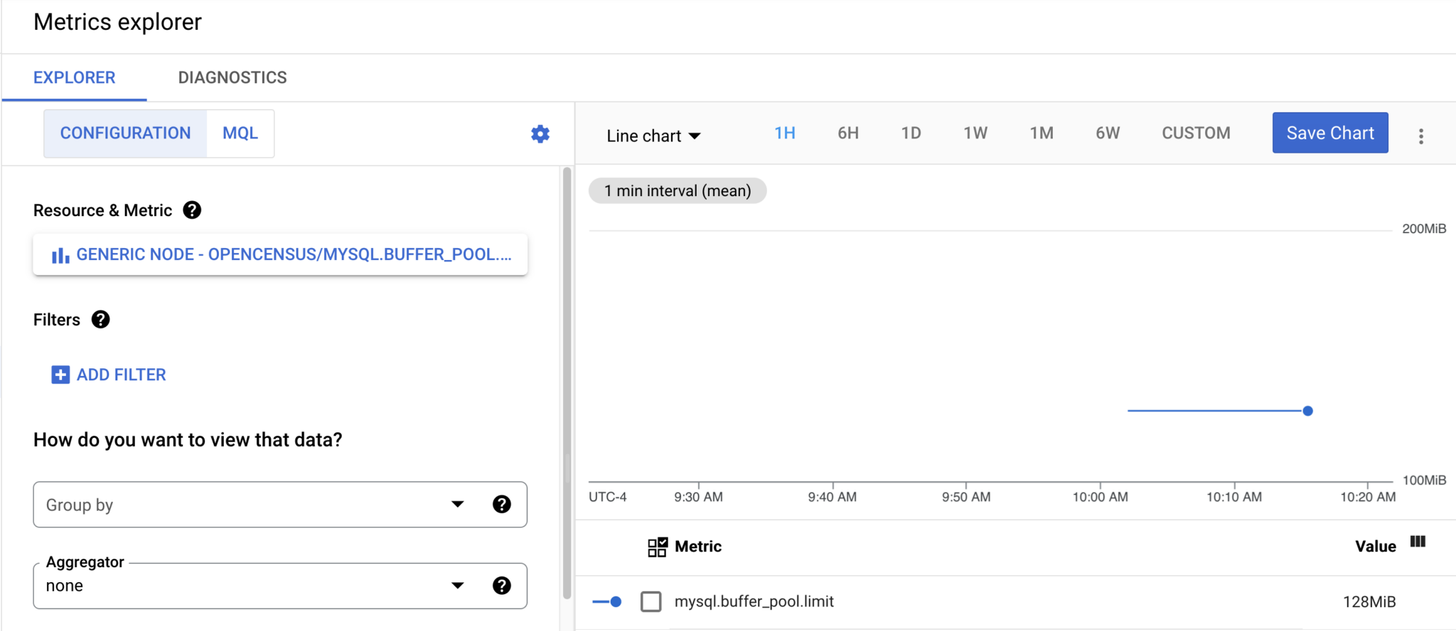
Once configured using the LPU I created, MySQL metrics should be flowing. We will focus on the specific metric `mysql.buffer_pool.limit` for our purposes. Currently our config.yaml MySQL section looks like this:
1mysql:
2    endpoint: localhost:3306
3    username: otel
4    password: otelPassword
5 collection_interval: 60sAfter waiting for at least 5 minutes to get a good amount of data, metrics will look something like this in Google’s Metrics Explorer:
Related Content: Turning Logs into Metrics with OpenTelemetry and BindPlane OP
Filtering
Now that metrics are flowing, we can filter them. First, let us discuss the reasons for filtering this specific metric. The answer is simple: it isn’t really all that useful or necessary. Barring a configuration change by the DBA, it will be a flat line. Even after a configuration change, it simply steps that flat line up or down.
To filter, we first need to look at the metadata file for the MySQL receiver. In this file, we find a listing of the attributes and metrics associated with this receiver. If we go to the metrics section of the file and see our pool limit metric, we learn it looks like this:
1mysql.buffer_pool.limit:
2  enabled: true
3  description: The configured size of the InnoDB buffer pool.
4  unit: By
5  sum:
6    value_type: int
7    input_type: string
8    monotonic: false
9 aggregation: cumulativeThis lets us know it is enabled by default and describes the metric and other essential data. As these are the defaults, we can interpret from it that if we set the `enabled` parameter to false, it should disable this metric–aka filter. It will not be collected; since it isn’t collected, it will also not be sent to the exporter.
To achieve this in our configuration file, we make the following changes:
1mysql:
2    endpoint: localhost:3306
3    username: otel
4    password: otelPassword
5    collection_interval: 60s
6    metrics:
7      mysql.buffer_pool.limit:
8 enabled: falseThis replicates the structure from the metadata file but with everything else trimmed other than the bare minimum number of lines needed to achieve our goal.
Once this has been changed and the collector restarted, I again wait at least 5 minutes and check Google’s Metrics Explorer to see what has changed:
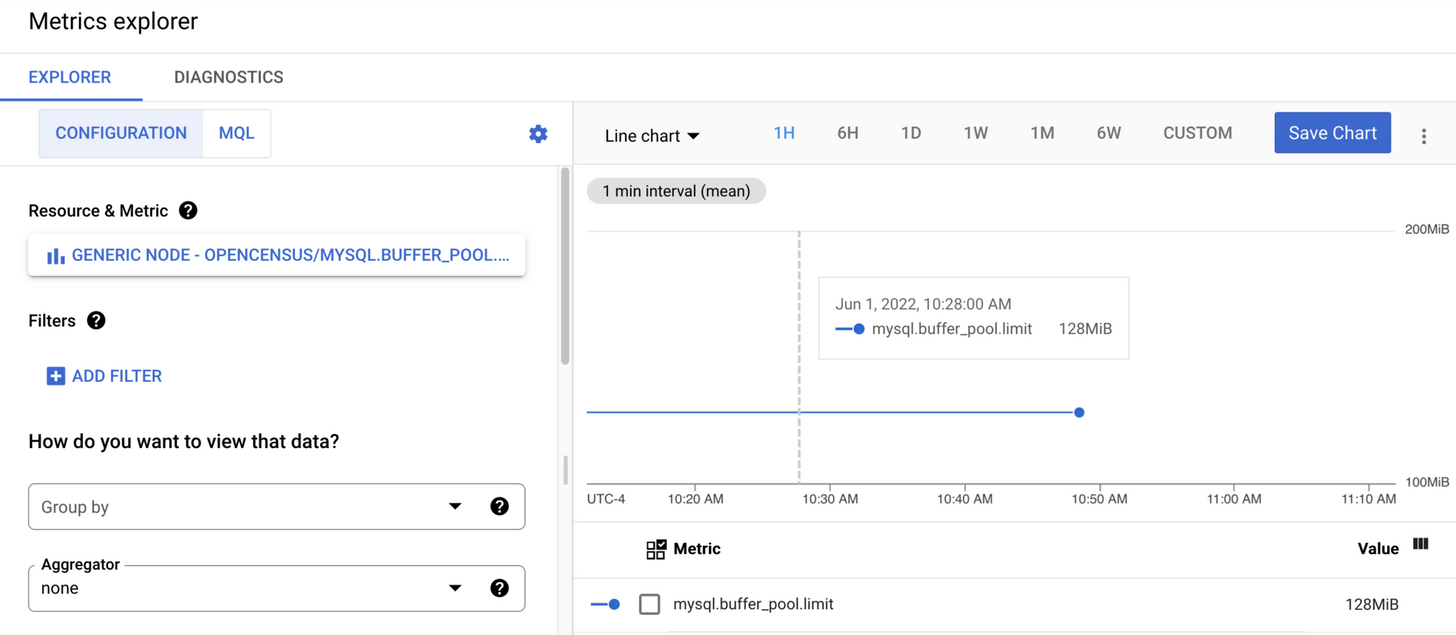
The screenshot shows that data was last sent to Google at 10:48, now 11:13.
Related Content: How to Monitor MySQL with OpenTelemetry
Conclusion
While the information needed is located in a few different places, filtering is straightforward. Also, one can always contact observIQ support if they need help finding the necessary documents to provide the information. Finally, don’t forget that the metadata we looked at also includes other helpful information for understanding your data.


