How to Monitor Solr with OpenTelemetry
Monitoring Solr is critical because it handles the search and analysis of data in your application. Simplifying this monitoring is necessary to gain complete visibility into Solr’s availability and ensure it performs as expected. We’ll show you how to do this using the jmxreceiver for the OpenTelemetry collector.
You can utilize this receiver in conjunction with any OTel collector, including the OpenTelemetry Collector and observIQ’s collector distribution.
What signals matter?
Monitoring Solr includes scraping JVM metrics, such as memory utilization and JVM threads, and the metrics exposed exclusively by Solr, such as request counts and Caching-related metrics. The JMX receiver scrapes all the metrics necessary to gather the following critical inferences:
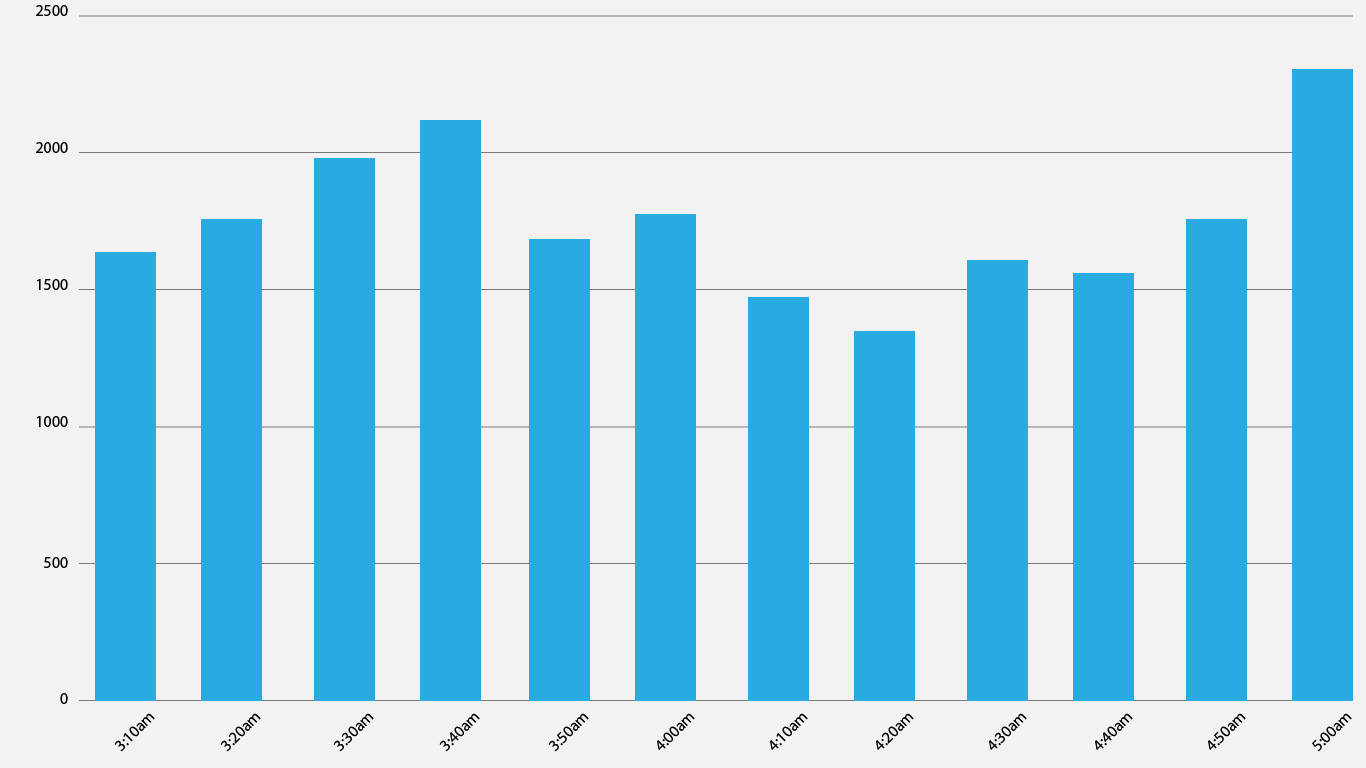
Understanding request handling using request rates
Solr nodes and clusters handle requests that are sent to it. Tracking the volume of received and handled requests helps fine-tune the performance and eliminate any bottlenecks. A dashboard for Solr can point to sudden dips or rises in requests received.
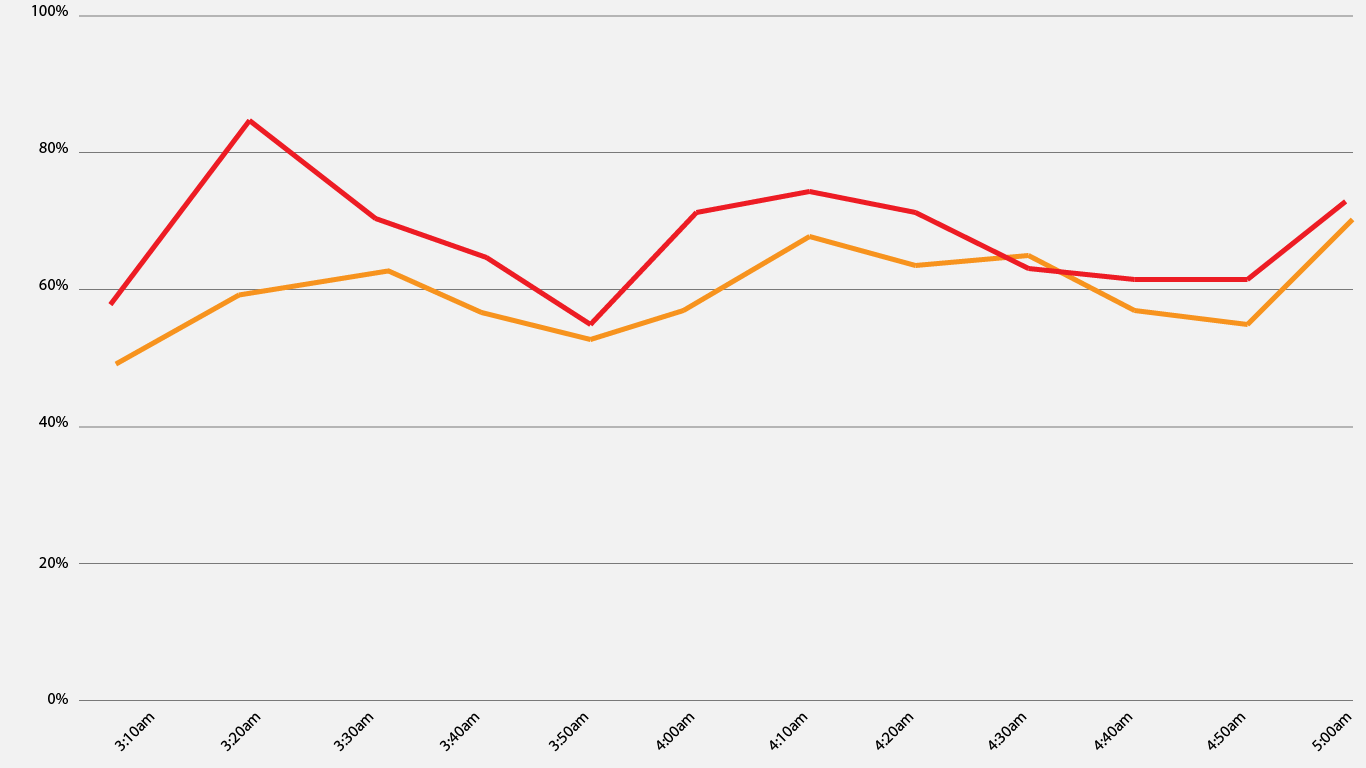
Monitoring caching capabilities
Caching is another key feature to monitor mainly because of Solr’s architecture. The caching feature facilitates easy access to cached data without buying into disk utilization. Usually, Caching leads to memory and disk expenses, which may bite into performance. Keeping all caching operations monitored ensures memory health and CPU utilization are optimized. Small caches lead to reduced hit rates, resulting in reduced node performance. At the same time, big caches deteriorate the JVM heaping performance and decrease the node performance.
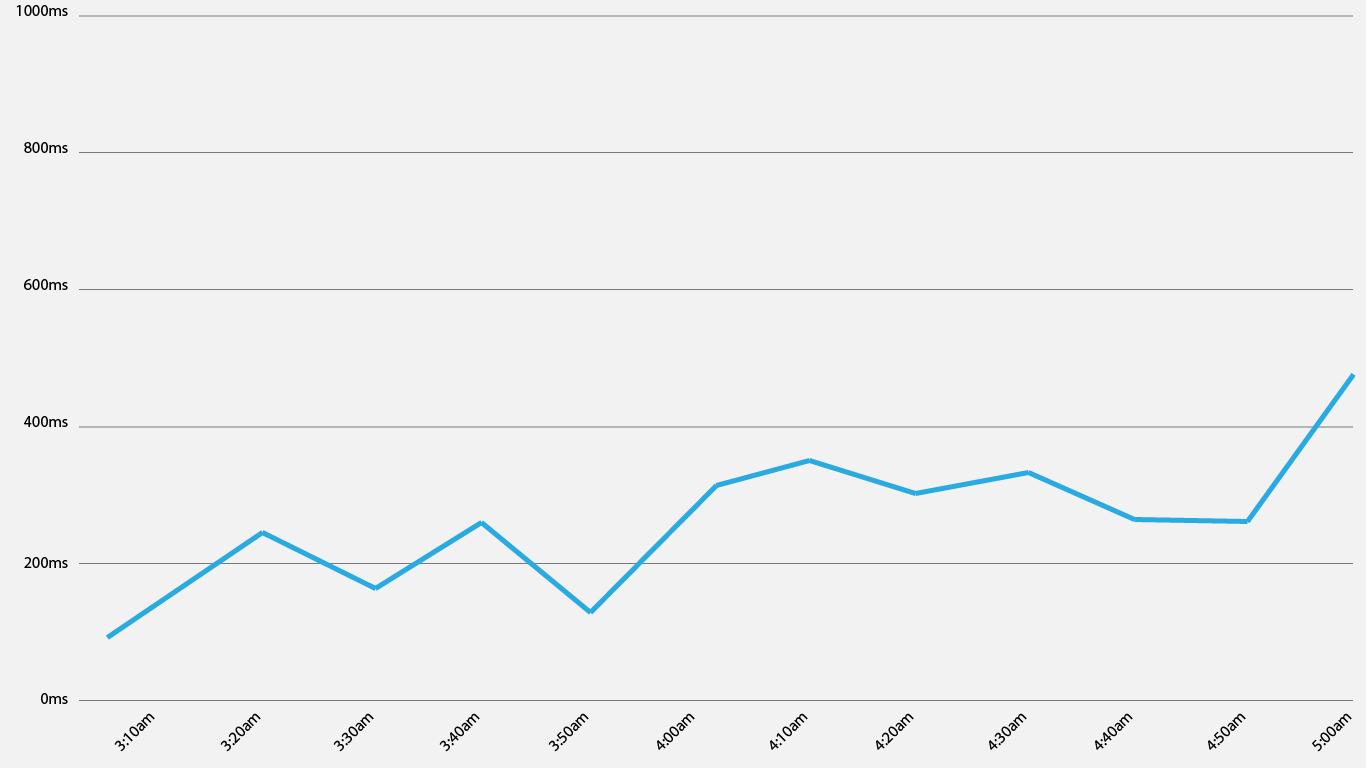
Request Latency
The pace at which the requests are handled is another critical factor to monitor closely. The request latency clearly indicates how the queries and requests are handled. In an architecture where the search handlers are assigned specific search categories, tracking the latency across these handlers can give the difference in request latency between each handler and each data type. Also, comparing the request latency and request rates helps quickly identify issues with request handling.
Configuring the JMX receiver to gather Solr metrics
You can use the following configuration to gather metrics using the JMX receiver and forward the metrics to the destination of your choice. OpenTelemetry supports over a dozen destinations to which you can forward the collected metrics. More information is available about exporters in OpenTelemetry’s rehttps://github.com/open-telemetry. In this sample, the configuration for the JMX receiver is covered.
Related Content: Turning Logs into Metrics with OpenTelemetry and BindPlane OP
Receiver configuration:
- Configure the collection_interval attribute. It is set to 60 seconds in this sample configuration.
- Set up the endpoint attribute as the system running the Solr instance.
- Specify the jar_path for the JMX receiver. We are using the JMX receiver to gather Solr metrics. The jar_path attribute lets you specify the path to the jar file that facilitates gathering Solr metrics using the JMX receiver. This file path is created automatically when the observIQ OpenTelemetry collector is installed.
- Set the target_system attribute to Solr. When we connect to the JMX receiver, there are different categories of metrics; the Solr metrics and JVM metrics are the ones that this configuration intends to scrape. This attribute specifies that.
- Use resource_attributes to set the local host port number.
1receivers:
2  jmx:
3    collection_interval: 30s
4    endpoint: localhost:9999
5    jar_path: /opt/opentelemetry-java-contrib-jmx-metrics.jar
6    target_system: solr
7    resource_attributes:
8 solr.endpoint: localhost:9999Processor configuration:
- The resourcedetection processor creates a unique identity for each metric host so that you can filter between the various hosts to view the metrics specific to that host.
- The system attribute gathers the host information.
- The batch processor is used to batch all the metrics together during collection.
1processors:
2  resourcedetection:
3    detectors: ["system"]
4    system:
5      hostname_sources: ["os"]
6
7 batch:Exporter Configuration:
The metrics are exported to New Relic using the OTLP exporter in this example. If you want to forward your metrics to a different destination, you can check the destinations OpenTelemetry supports here.
1exporters:
2  otlp:
3    endpoint: https://otlp.nr-data.net:443
4    headers:
5      api-key: 00000-00000-00000
6    tls:
7 insecure: falseSetup the pipeline:
1service:
2  pipelines:
3    metrics:
4      receivers:
5      - jmx
6      processors:
7      - resourcedetection
8      - batch
9      exporters:
10 - otlpViewing the metrics
All the metrics the JMX receiver scrapes are listed below.
Alerting
Now that you have the metrics gathered and exported to the destination of your choice, you can explore how to configure alerts for these metrics effectively. Here are some alerting possibilities for Solr:
- Alerts to notify that the Solr server is down
- Alerts based on threshold values for request rate, cache size, timeout count, cache hit count
- Alerts for anomaly scenarios where the values of specific metrics deviate from the baseline
- Set up resampling to avoid reacting to false alarms
- Notifying the on-call support team about any critical alerts
Related Content: How to Install and Configure an OpenTelemetry Collector
observIQ’s distribution is a game-changer for companies looking to implement the OpenTelemetry standards. The single-line installer, seamlessly integrated receivers, exporter, and processor pool make working with this collector simple. Follow this space to keep up with all our future posts and simplified configurations for various sources. For questions, requests, and suggestions, contact our support team at support@observIQ.com.