How to Monitor Hadoop with OpenTelemetry
We are back with a simplified configuration for another critical open-source component, Hadoop. Monitoring Hadoop applications helps to ensure that the data sets are distributed as expected across the cluster. Although Hadoop is considered to be very resilient to network mishaps, monitoring Hadoop clusters is inevitable. Hadoop is monitored using the JMX receiver.
The configuration detailed in this post uses observIQ’s distribution of the OpenTelemetry collector. We are simplifying the use of OpenTelemetry for all users. If you are as excited as we are, take a look at the details of this support in our repo.
The JMX receiver used in this configuration works with any Open Telemetry collector, including the OpenTelemetry Collector and observIQ’s distribution of the collector.
What signals matter?
Monitoring performance metrics for Hadoop is necessary to ensure that all the jobs are running as expected and the clusters humming. The following categories of metrics are monitored using this configuration:
HDFS Metrics:
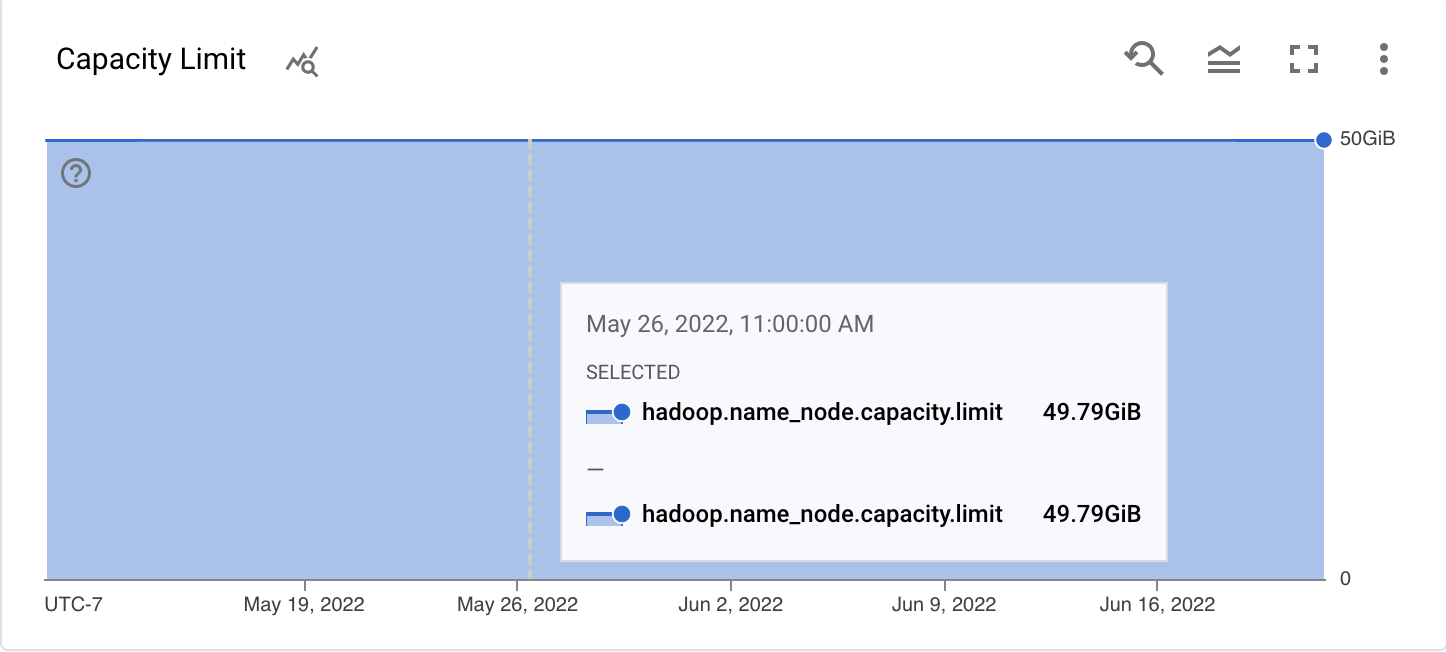
It is critical to monitor the Apache Hadoop Distributed File System(HDFS) to ensure the disc space availability and data storage optimization and to track the capacity of the file system. There are two types of HDFS metrics, namely, NameNode and DataNode. In the HDFS architecture, there is a single NameNode with multiple Datanodes. Metrics related to the NameNode are the most important metrics to monitor; any failure in the NameNode renders the data in that cluster inaccessible. The most critical metrics to scrape are:
- Use the metrics to gauge the overall performance of the Hadoop system.
- Keep track of anomalies in data directory growth and optimize data storage across the entire Hadoop system.
All metrics related to the categories above can be gathered with the JMX receiver – so let’s get started!
Related Content: How to monitor Solr with OpenTelemetry
Configuring the jmxreceiver
After the installation, the config file for the collector can be found at:
- C:\Program Files\observIQ OpenTelemetry Collector\config.yaml (Windows)
- /opt/observiq-otel-collector/config.yaml(Linux)
Receiver Configuration:
- Specify the jar_path for the JMX receiver. We are using the JMX receiver to gather Hadoop metrics. The jar_path attribute lets you specify the path to the jar file, which facilitates gathering Hadoop metrics. This file path is created automatically when observIQ’s distribution of the OpenTelemetry Collector is installed.
- Setup the endpoint attribute as the system that is running the Hadoop instance
- Set the target_system attribute to Hadoop and JVM. When we connect to the JMX receiver, there are different metrics categories; the Hadoop and JVM metrics are the ones that this configuration intends to scrape. This attribute specifies that.
- Configure the collection_interval attribute. It is set to 60 seconds in this sample configuration.
Related Content: Configuration Management in BindPlane OP
Use resource_attributes to set the local host port number. The properties option allows you to set arbitrary attributes. For instance, if you are configuring multiple JMX receivers to collect metrics from many Hadoop servers, this attribute enables you to set the unique IP addresses for each endpoint system. So that you know, this is not the only use of the properties option.
1receivers:
2  jmx:
3    jar_path: /opt/opentelemetry-java-contrib-jmx-metrics.jar
4    endpoint: localhost:8004
5    target_system: hadoop,jvm
6    collection_interval: 60s
7    resource_attributes:
8 hadoop.endpoint: localhost:8004Processors:
- The resource detection processor is used to create a distinction between metrics received from multiple Hadoop systems. This helps filter metrics from specific Redis hosts in the monitoring tool, such as Google Cloud operations.
- Add the batch processor to bundle the metrics from multiple receivers. We highly recommend using this processor in the configuration, especially for the benefit of the collector's logging component. If you would like to learn more about this processor, please check the documentation.
1processors:
2  resourcedetection:
3    detectors: ["system"]
4    system:
5      hostname_sources: ["os"]
6batch:Exporters:
In this example, the metrics are exported to Google Cloud Operations using the googlecloudexporter. If you want to forward your metrics to a different destination, you can check the destinations OpenTelemetry supports here.
1exporters:
2  googlecloud:
3    metric:
4      resource_filters:
5 - prefix: hadoopSet up the pipeline:
1service:
2  pipelines:
3    metrics:
4      receivers:
5      - jmx
6      exporters:
7 - googlecloudViewing the metrics collected
All the metrics the JMX receiver scrapes are listed below.
Alerting:
With these metrics and dashboards created for the Hadoop server, here are some alerting and monitoring steps that you can implement:
- In addition to the metrics specific to the Hadoop server, the OS and JVM metrics are tracked to give a complete view of the data usage capacity and projects for the HDFS.
- Set alerting for thresholds for capacity, blocks missing, block corrupt, and volume failures.
- Avoid false alarms by resampling the metrics.
- Set up alerts for failures related to individual data nodes.
- Set up alerts for memory shortage-related metric thresholds.
observIQ’s distribution is a game-changer for companies looking to implement the OpenTelemetry standards. The single-line installer, seamlessly integrated receivers, exporter, and processor pool make working with this collector simple. Follow this space to keep up with all our future posts and simplified configurations for various sources. For questions, requests, and suggestions, contact our support team at support@observIQ.com or join the conversation on Slack!


