Rapid telemetry for Windows with OpenTelemetry and BindPlane OP
At observIQ, we’ve seen continuous customer interest in scalable and performant observability solutions for Windows environments. As of 2023, Windows is estimated to be deployed to 75% of desktops worldwide. Unsurprisingly, we commonly speak to CTOs, DevOps, and IT managers responsible for managing fleets of thousands of Windows-based end-user and point-of-sale systems in the Financial, Healthcare, Insurance, and Education sectors.
With a well-rounded set of integrations and OTel's logging library moving to a stable status in 2023, organizations now have access to an open, performant, and standardized framework to observe Windows fleets at scale.
Based on customer demand and feedback - we’ve focused on making Windows a simple and powerful experience for customers - both contributions to OTel and specialized features in BindPlane OP, understanding that Windows infrastructure is critical and here to stay well into the foreseeable future.
In this post, I’ll walk you through the following:
- Top Windows Use Cases
- Useful Windows OTel Components
- How to use BindPlane OP to simplify…
- Installing an OpenTelemetry Collector on Windows
- Creating a single OTel config, satisfying all of the above use cases
- Remotely deploy the OTel config to a fleet of Windows collectors
Top Use Cases for Windows
Over the past six months, customers have been inquiring about these use cases the most:
- Observing the health of a fleet of Windows VMs or POS systems by gathering OS and Process metrics
- Observing Security/Logon activity by collecting and analyzing Windows Events
- Observing IIS using application metrics, host metrics, application logs, and Windows system events
Useful OTel Components for Windows
Here’s a quick list of the most valuable components I’d recommend looking at if you’re considering OTel for stack. It’s worth looking at the configuration parameters and component limitations to ensure they’ll address your needs. Here’s a short list of the most valuable components for a typical Windows environment.
Receivers
- Active Directory Domain Services Receiver
- Host Metrics Receiver
- IIS Receiver
- Windows Event Log Receiver
- Windows Performance Counter Receiver
- Microsoft SQL Server Receiver
- Filelog Receiver
Processors
- Filter Processor
- Transform Processor
- Resource Detection Processor
Exporters
- Verify you can find your desired destination here.
Solving Windows Use Cases with OTel and BindPlane OP
Pre-reqs:
If you’d like to follow along and build and deploy the configure, you’ll need a few things handy:
- A running BindPlane OP instance. You can install the free edition on a Linux VM or container by following the steps provided here: https://observiq.com/download
- Access to one more Windows Machines you’d like to observe: Windows 10, Server 2012 R2 or later. Optionally, with IIS running and steady Windows event activity, if you would like a more representative test.
- 15 minutes of your time.
Once you have an environment handy, you can proceed to the next step.
Install an OpenTelemtry collector on Windows with BindPlane OP
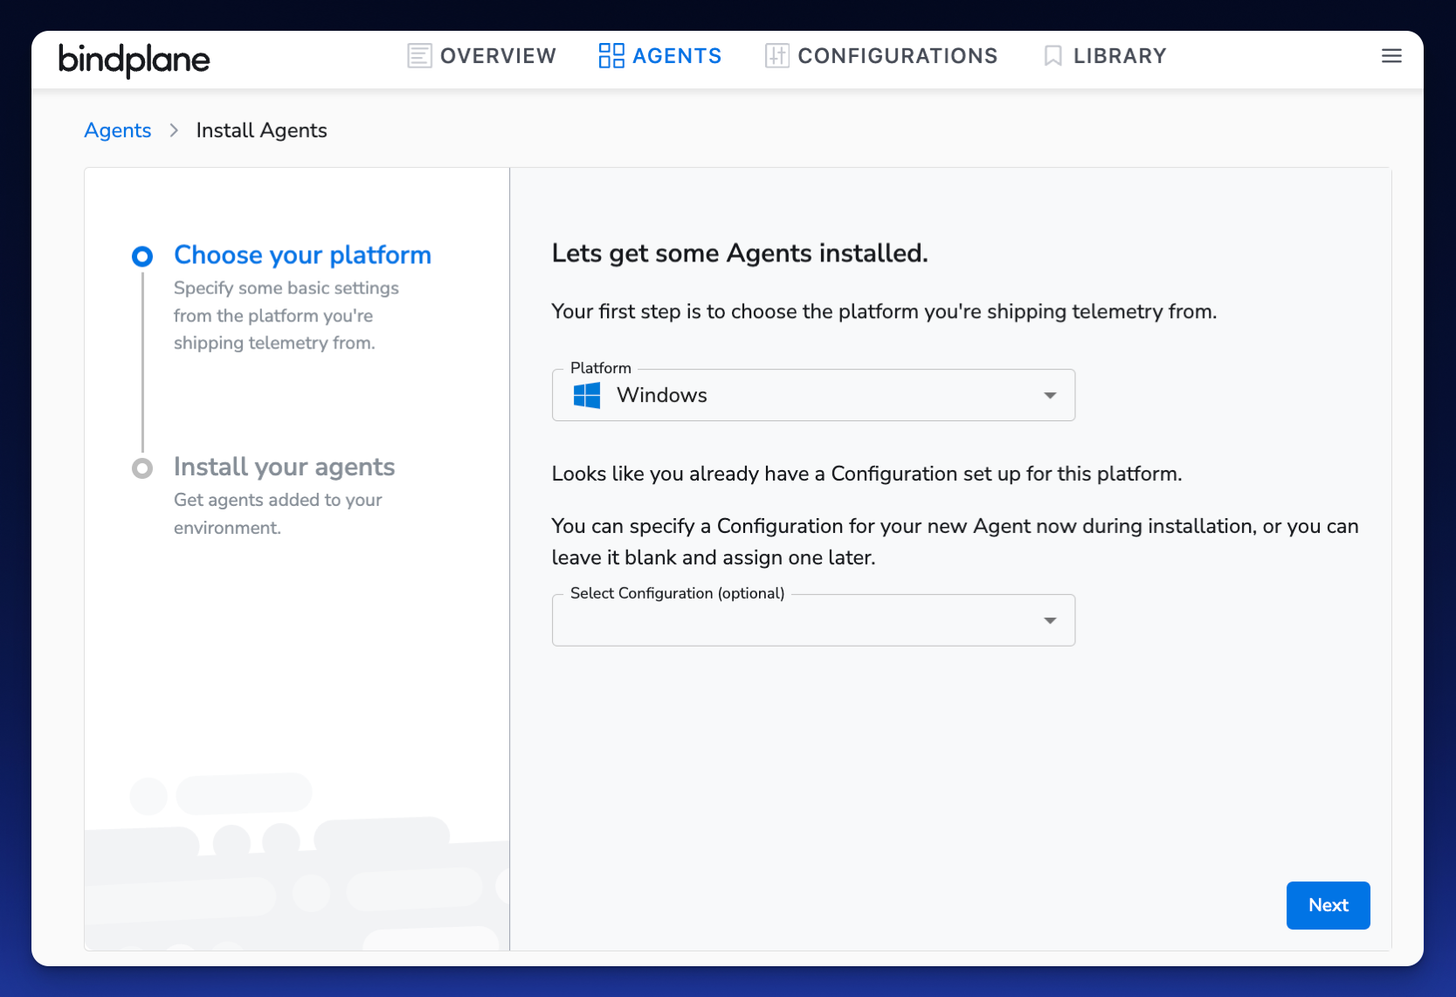
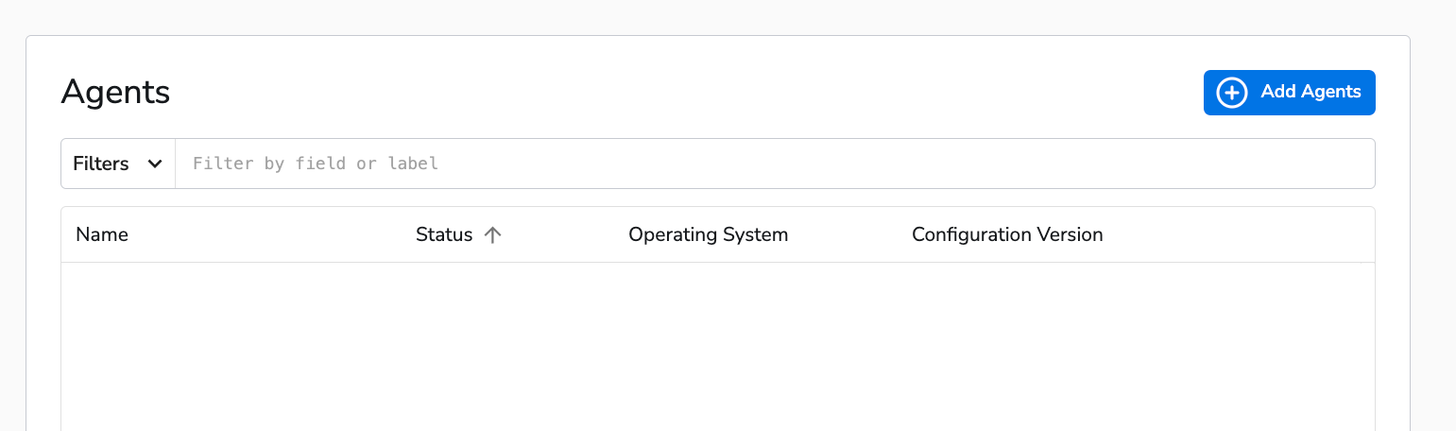
I’ll start by logging into my BindPlane OP instance. From the Agents tab, select Install Agent, and select Windows as the operating system.
RDP into your host, open an elevated CMD prompt, and run the provided single-line installation command. After a few moments, the agent will appear in the list of agents in BindPlane OP, indicating it’s been connected and managed by BindPlane. Rinse and repeat for each Windows host you’d like to observe.
Related Content: Configuration Management in BindPlane OP
Create an OTel configuration with BindPlane OP
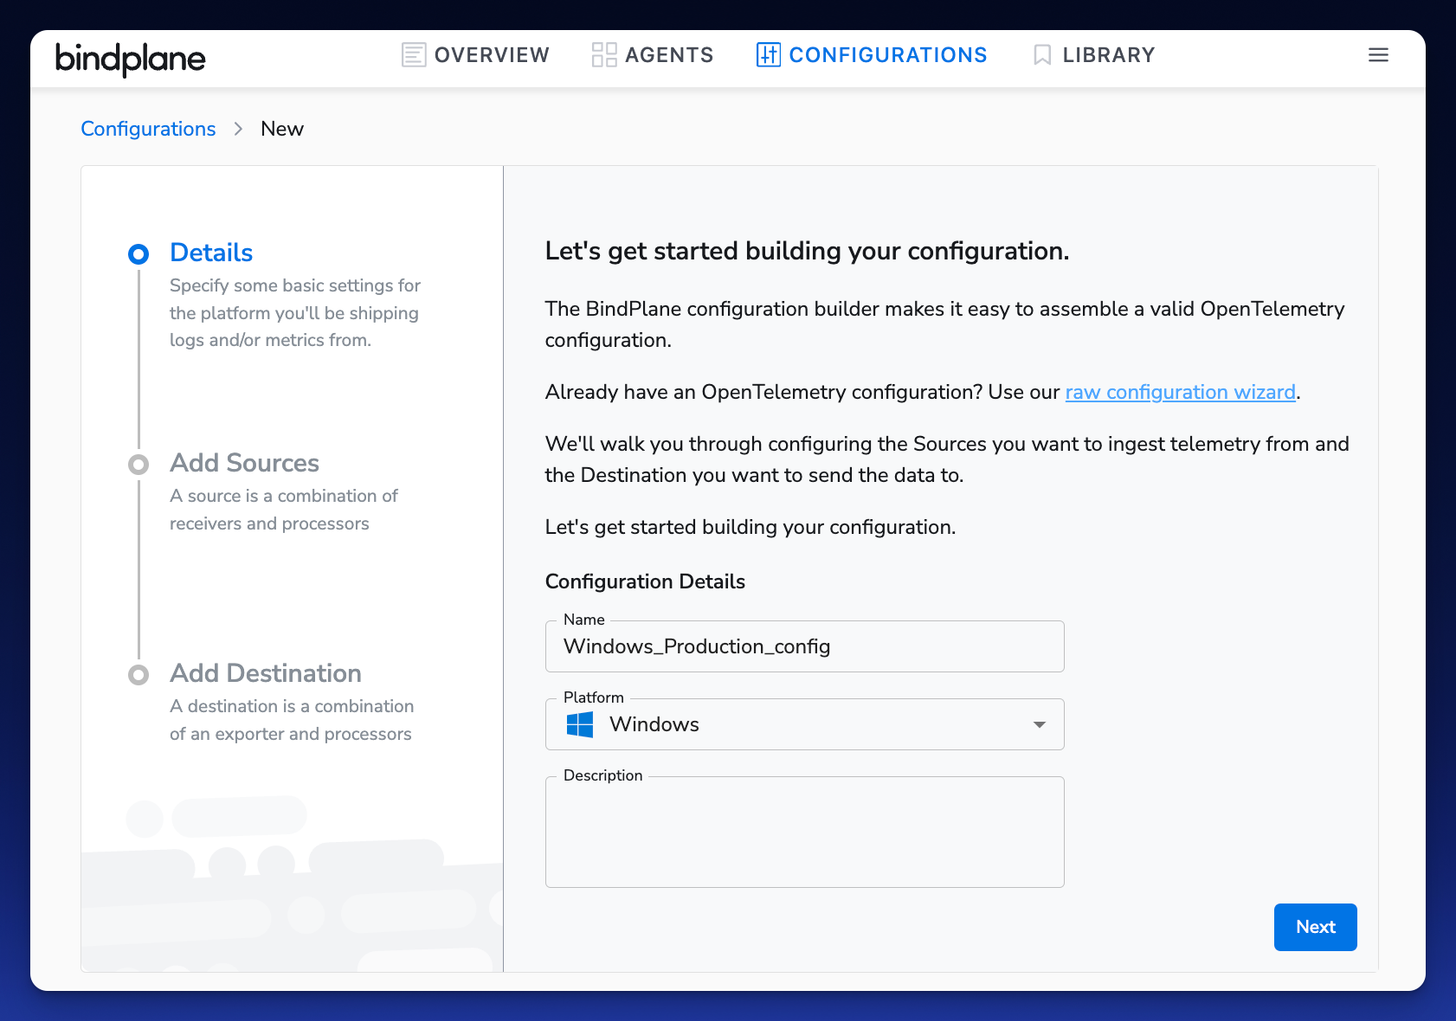
From BindPlane OP’s Configurations tab, select Create Configuration. Give the configuration an apt name, and select Windows as the Operating System. Then, start adding sources to the configuration via BindPlane OP’s configuration builder.
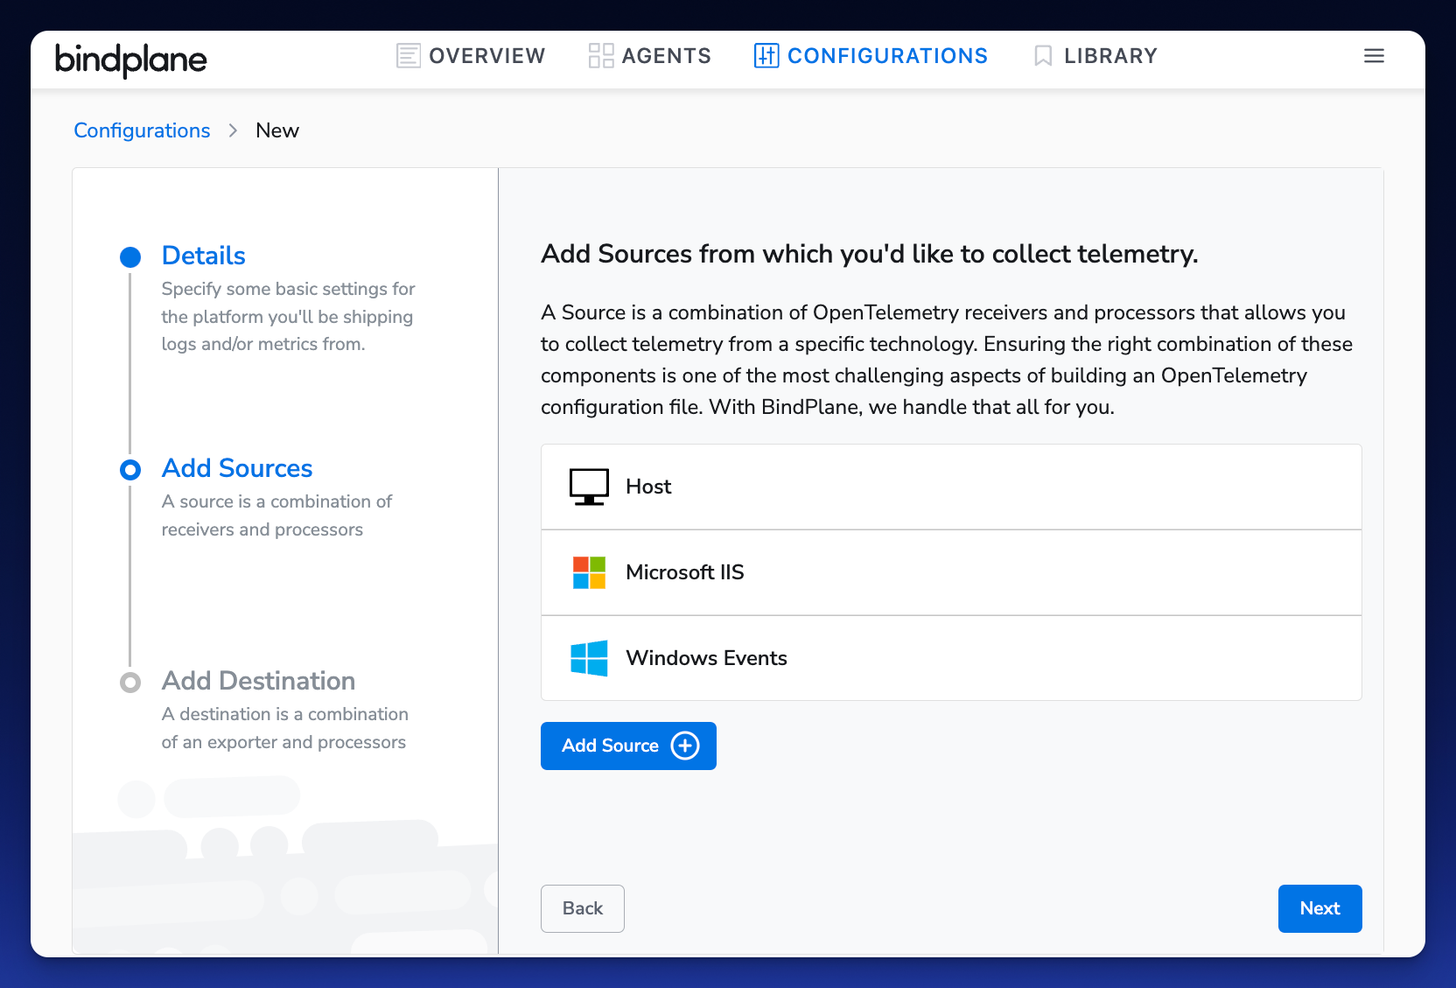
Add Sources (OTel receivers) to your config
For this example, we’ll add the following Sources to our Configuration. A Source can gather metrics, logs, or traces depending on the application or system you want to observe.
Select the applicable metrics and log files you want to collect for each Source. Note: BindPlane OP suggests default metrics and log paths, but it is worth double-checking they meet your needs and system configuration.
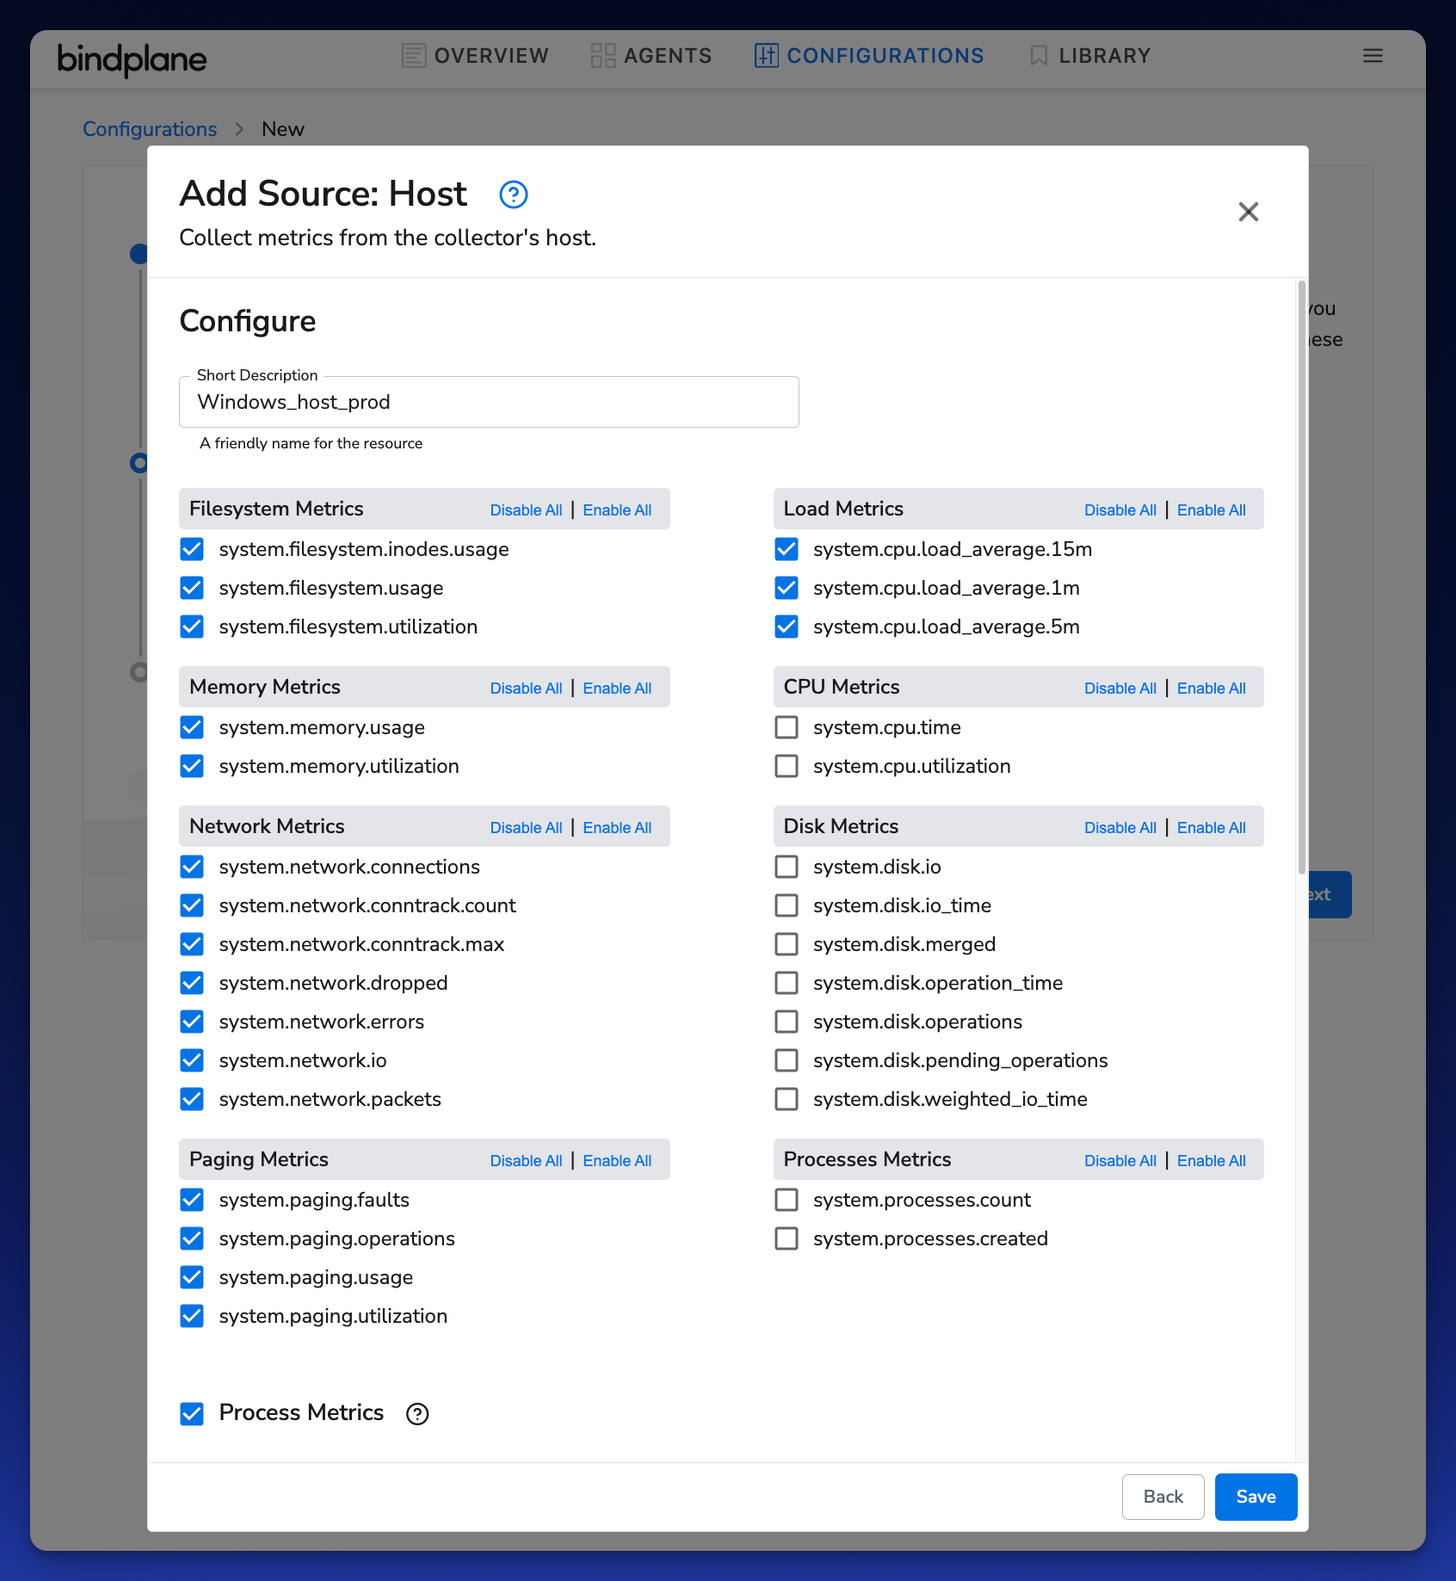
Host Source
The Host Source gathers metrics from a host: consumption and process metrics. It requires minimal configuration - only a friendly description. To the bottom right, you'll see process metrics as well. In this example, I will leave the default selections and save the Source to my config.
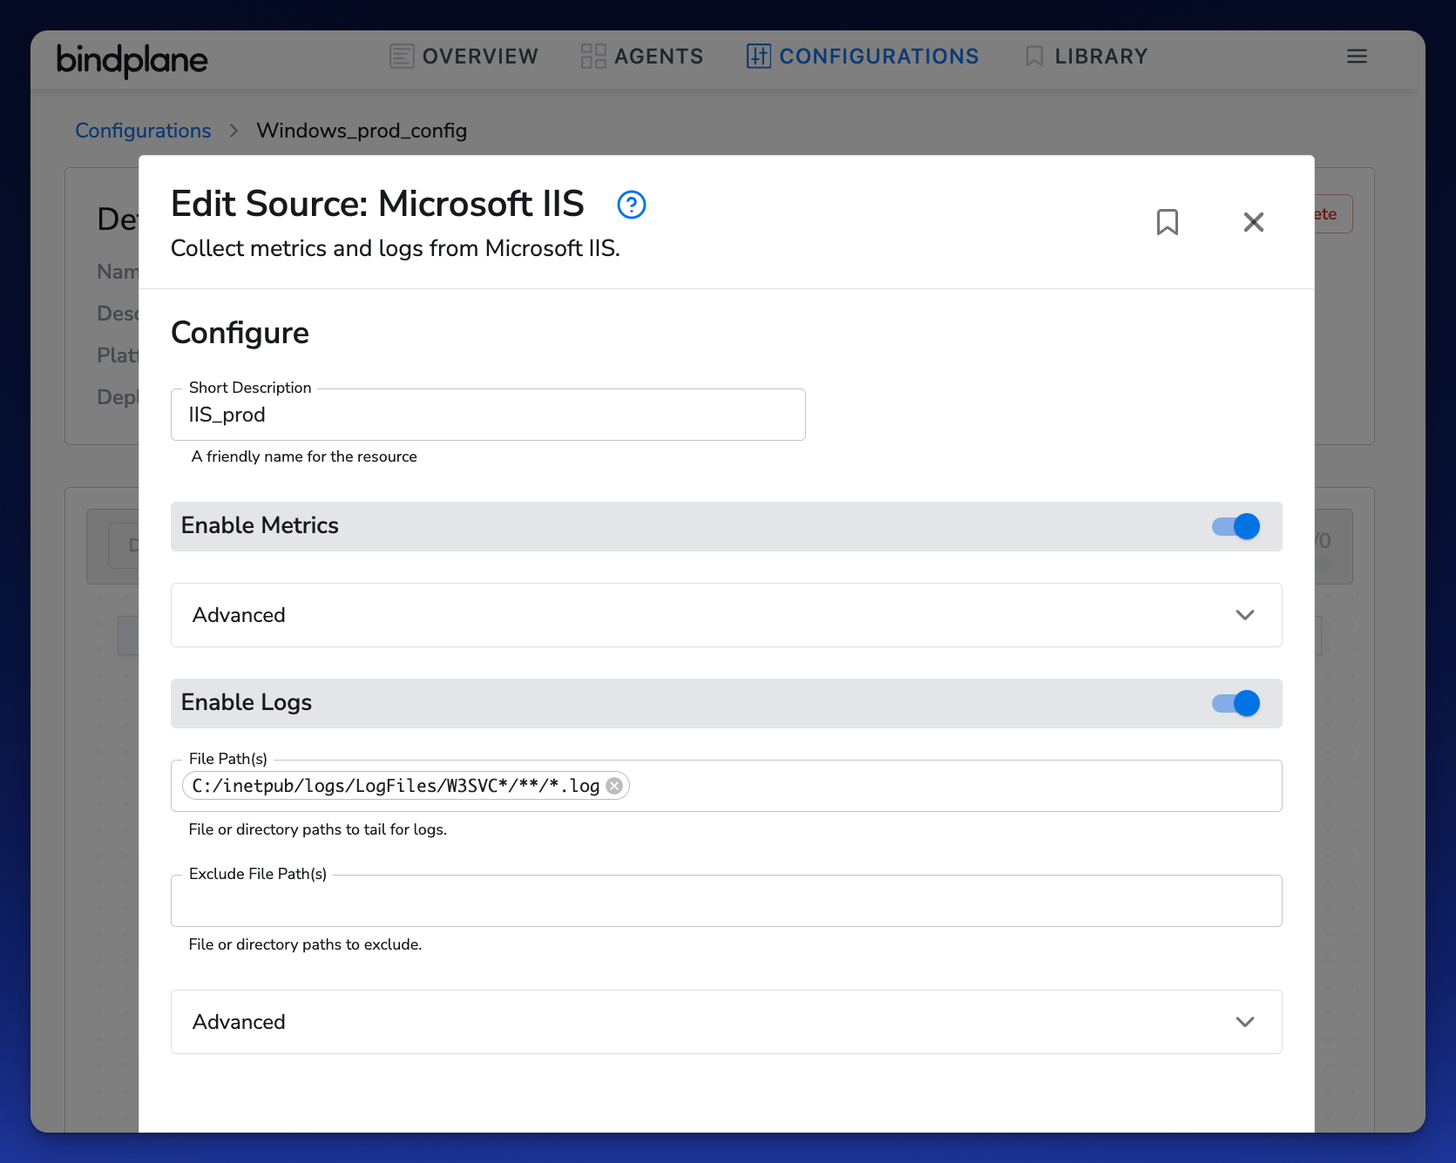
IIS Source
The IIS Source requires a bit more configuration; it can collect metrics and logs from an IIS instance. Again, I will leave the default selections: enabling metrics and validating the default log file’s path matches my test systems.
Windows Events Source
Lastly, I will add the Windows Events Source to my config. The Windows Events Source collects Windows Events and turns them into structured JSON logs. The big 3 channels are gathered by default (System, Security, and Application), which is what I need for my config to satisfy my use cases above. My config now includes 3 Sources; now I need a Destination.
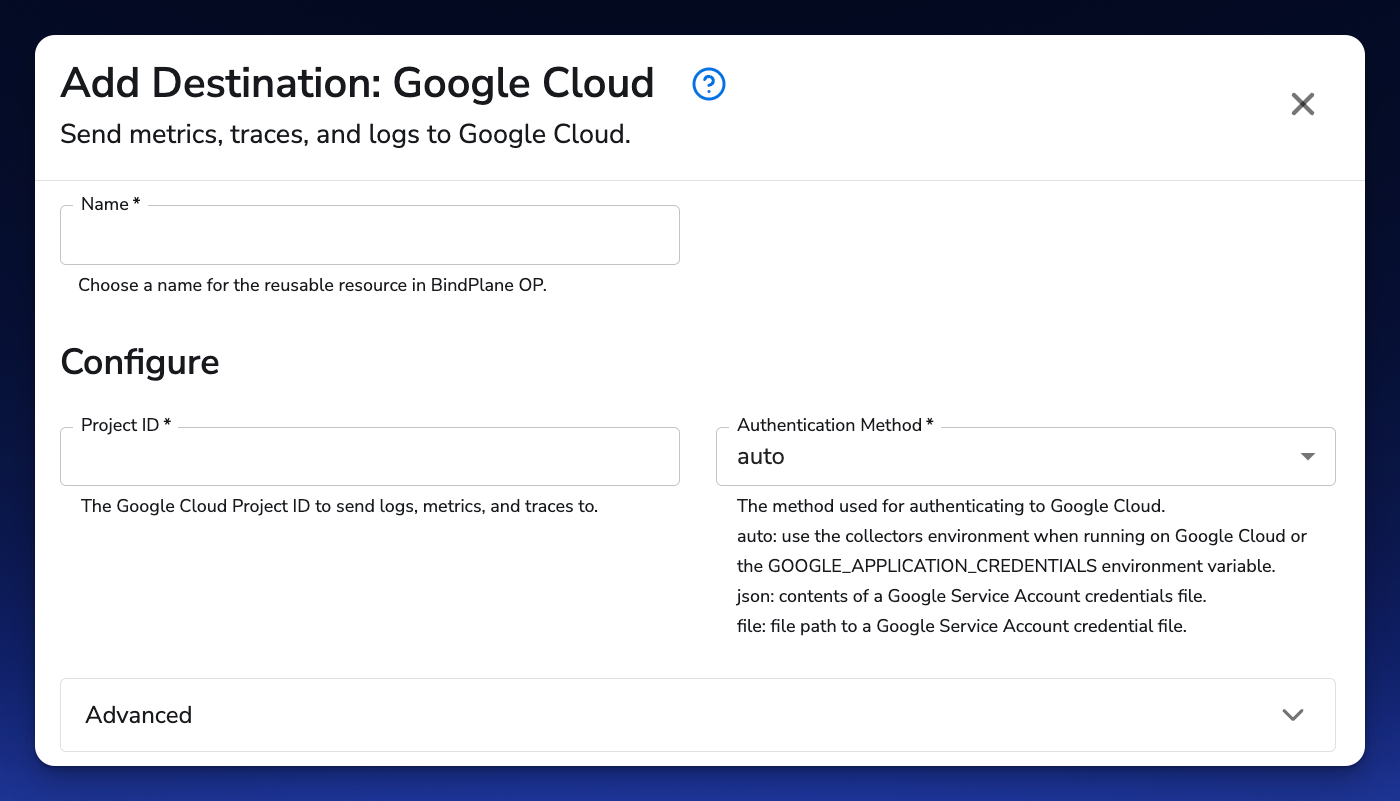
Add a Destination (OTel Exporter)
Lastly, I’ll add a Destination to my config. In this example, I’ll ship telemetry data to Google Cloud Operations. Creating a Destination in BindPlane OP provides approximately the same experience for all backends: some combination of an API key, credentials, and region.
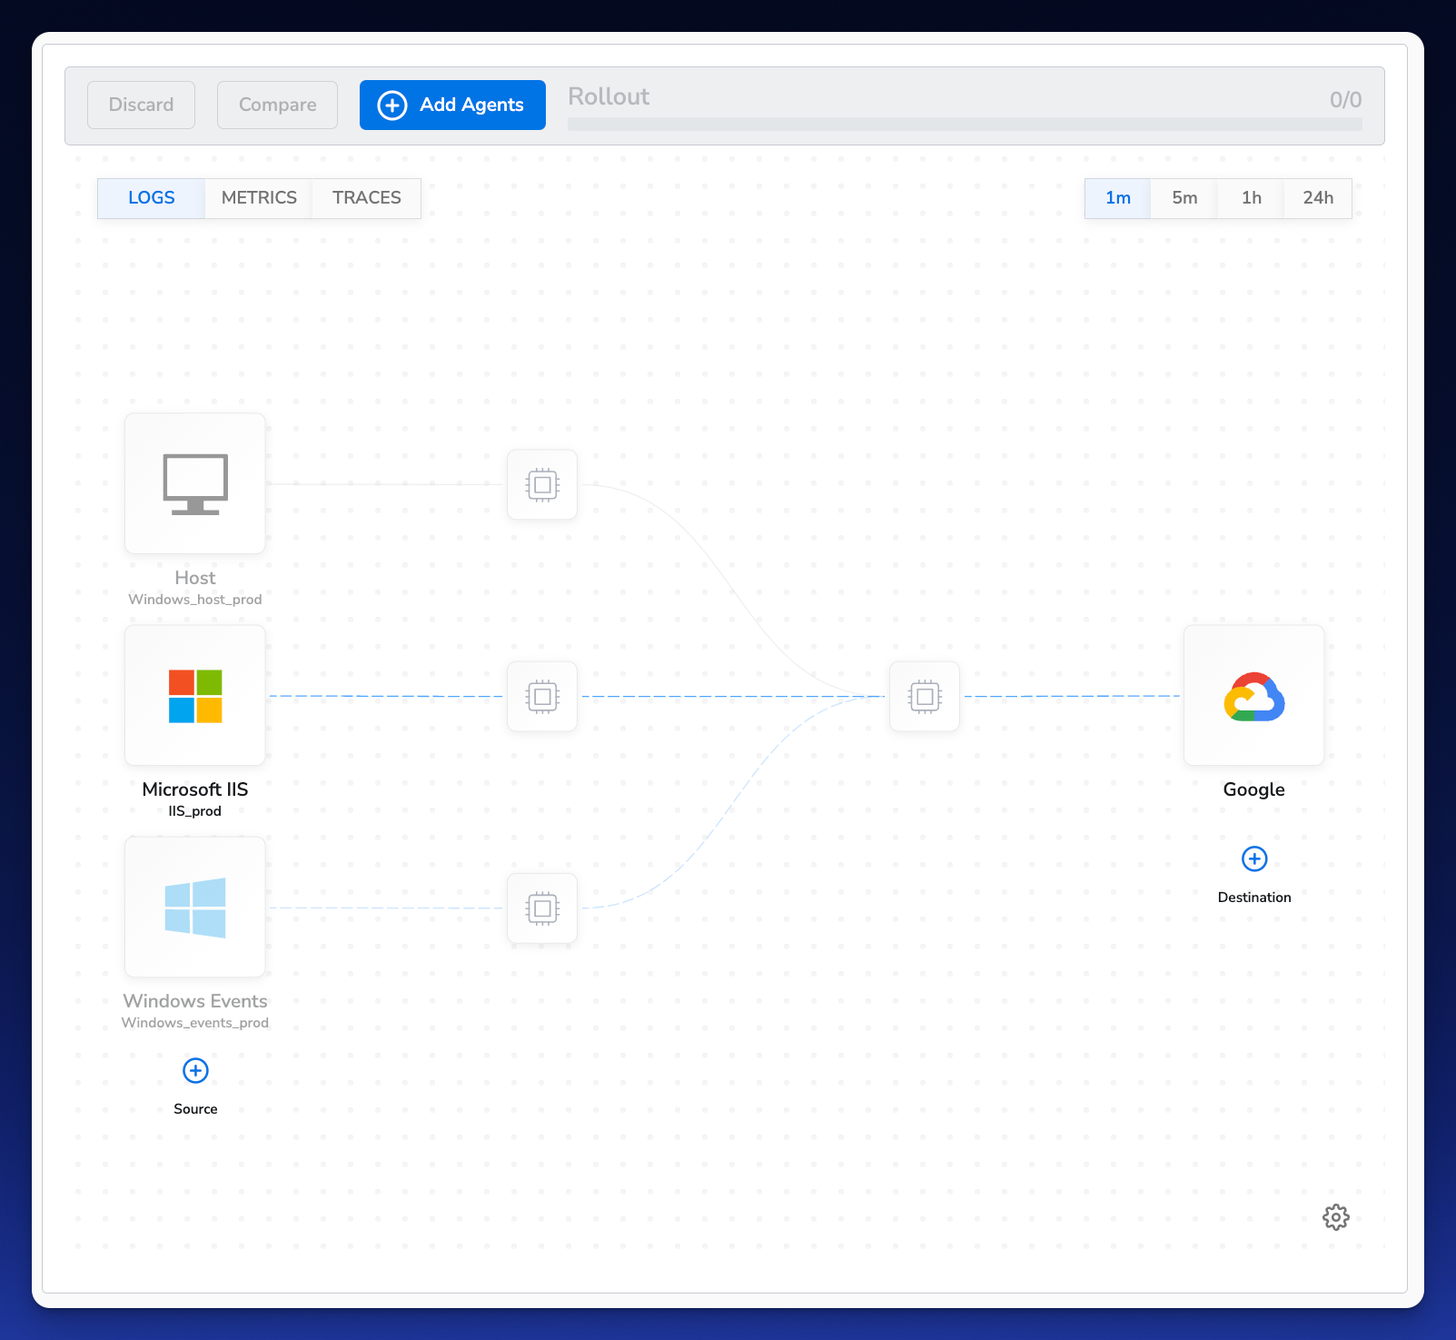
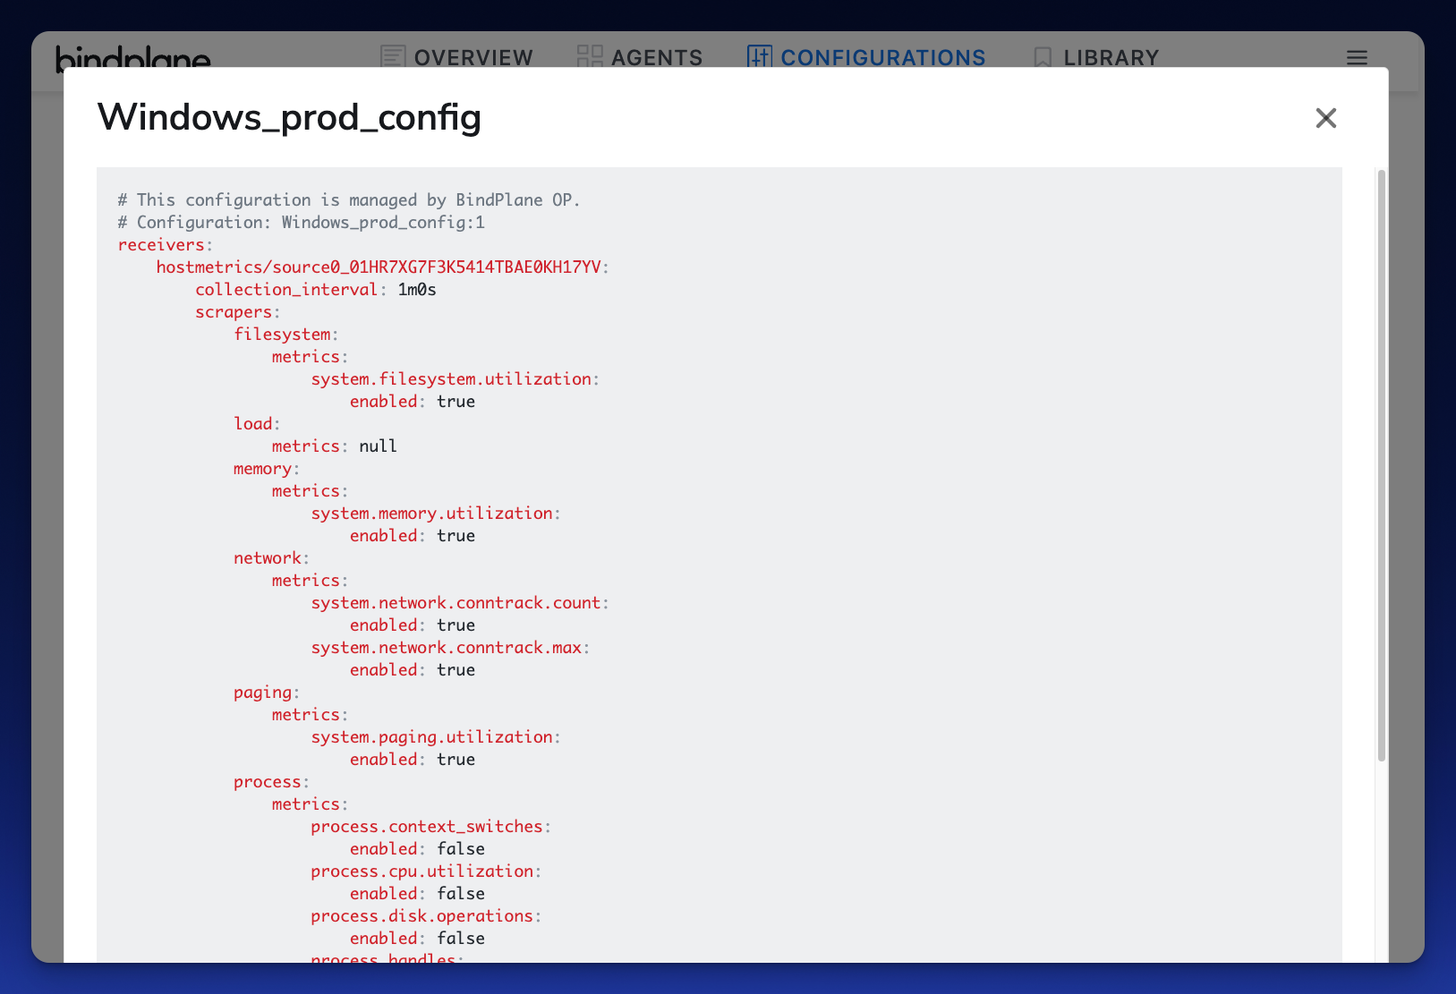
After saving my Destination, I have a fully-baked OTel configuration file :airhorn_sound:.
I now also have a human-readable representation of what’s in the file and the option to export it in raw form. Now, I can deploy this configuration to my agents and start shipping telemetry to my destination for further analysis.
Next, let's push our OTel configuration to our collectors.
Related Content: Getting Started with BindPlane OP and Google Cloud Operations
Deploy your OTel config to your OTel Collectors with BindPlane OP
Lastly, I only need to scroll down to the agent’s section of the configuration page and select Add Agents. Apply the configuration to your agents, and select Start Rollout. BindPlane OP will now push the configuration I’ve built to each agent (via OpAMP, under the hood).
Verify and telemetry data in your Destination
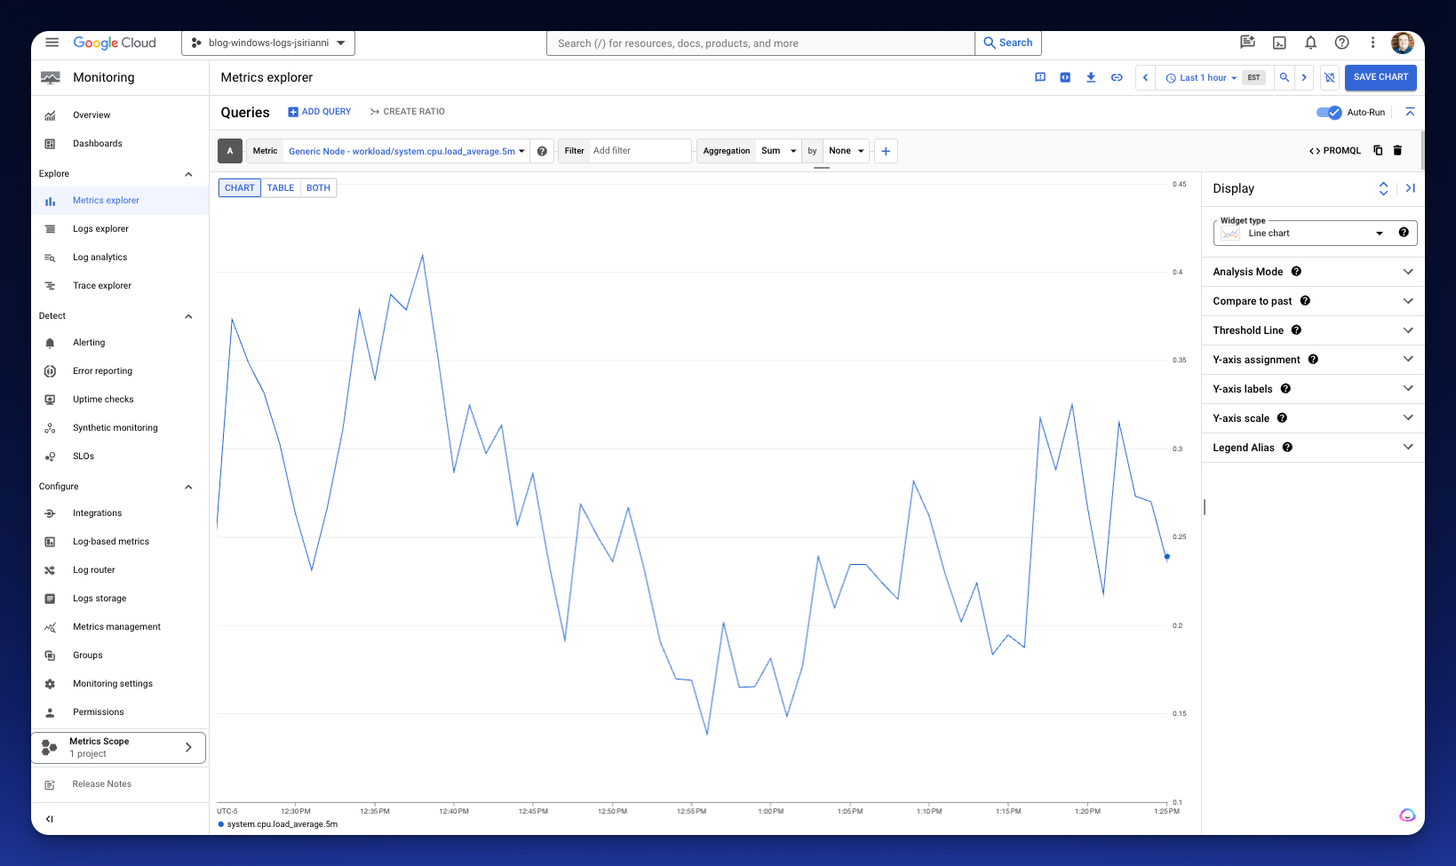
Now that I’ve configured my OTel collectors to ship data to Google Cloud, I’ll hop over and verify it’s arrived successfully. Drumroll….
And there it is! All of the signals I need to satisfy my use cases:
- Host metrics and events observe the health of my Windows hosts.
- Security Events to monitor successful and failed logon activity of my fleet.
- IIS application metrics and logs are used to understand the health of my web server, which can be correlated with the host metrics and events above in the event of an outage.
Wrapping up
Well, there you have it. Creating an OTel configuration for Windows (and other platforms) is incredibly simple. If you have any questions about pairing OpenTelemetry or BindPlane OP, reach out to us at info@observiq.com.


