How to Monitor Tomcat with OpenTelemetry
We are constantly working on contributing monitoring support for various sources; the latest in that line is support for Tomcat monitoring using the JMX Receiver in the OpenTelemetry collector. If you are as excited as we are, look at the details of this support in OpenTelemetry’s repo.
You can utilize this receiver in conjunction with any OTel Collector, including the OpenTelemetry Collector and observIQ’s distribution of the collector.
In this post, we take you through the steps to set up this receiver with observIQ’s distribution of the OpenTelemetry Collector and send out the metrics to Google Cloud Operations.
What signals matter?
Performance metrics are the most important to monitor for Tomcat servers. Here’s a list of signals to keep track of:
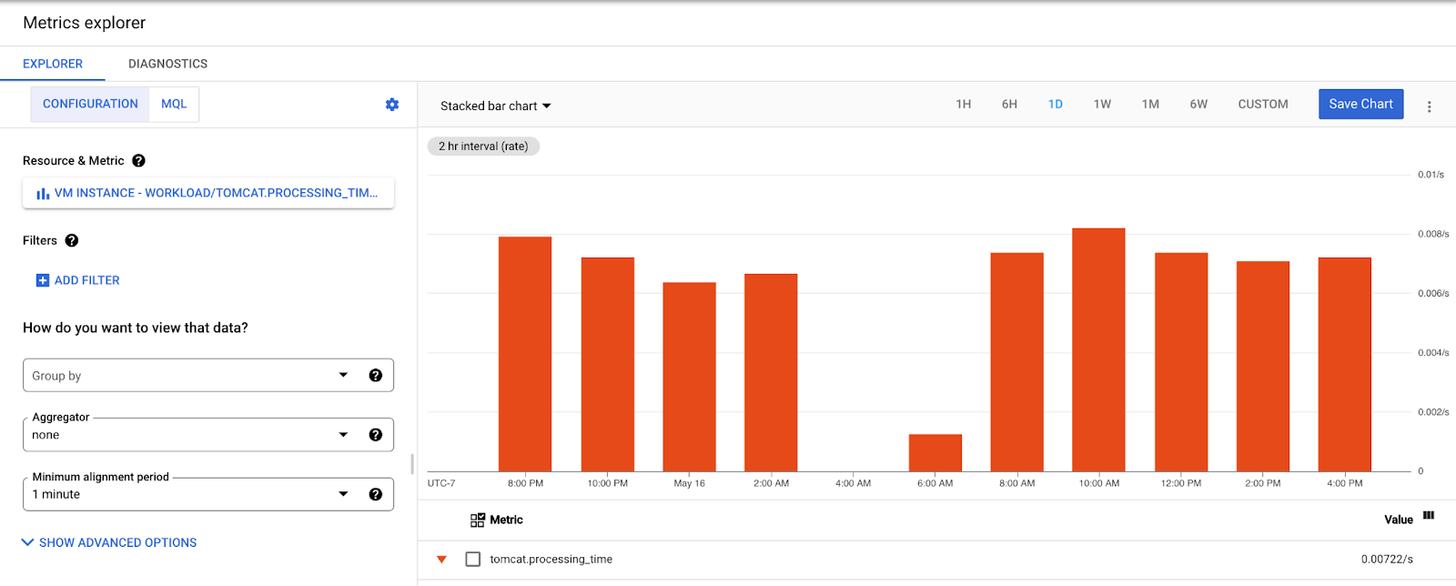
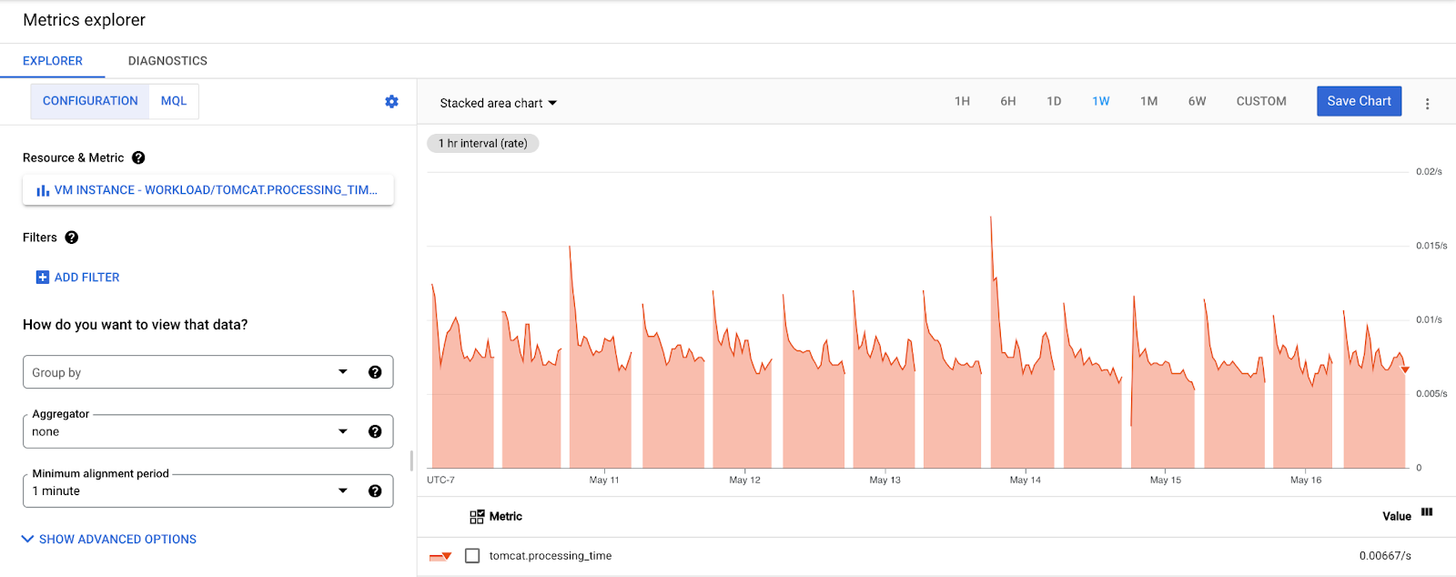
- Application metrics: Metrics related to each application that is deployed. Metrics such as tomcat.sessions and tomcat.processing_time gives insight into the number of active sessions and the processing times for the application since startup.
- Request Processor Metrics: Monitoring the request processing times helps gauge the hardware needs to enable the Tomcat server to handle the required number of requests in a specific period. Metrics such astomcat.request_count and tomcat.max_time gives insights into the total number of requests processed since the start time and the maximum time taken to process a request.
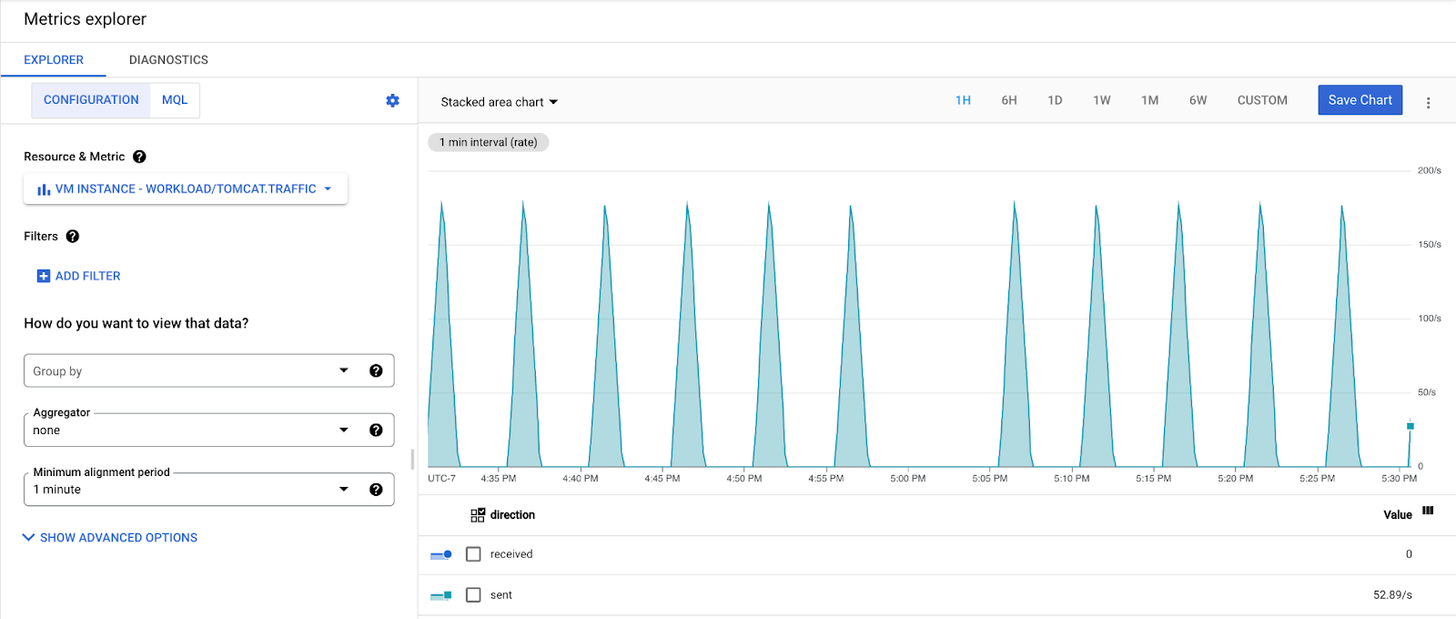
- Managing the traffic to the server: Tracking requests sent and received gives a good idea of the volume of traffic the server is handling at any time. This is essential, especially during peak traffic times, as it closely monitors the server’s performance based on traffic volumes. The tomcat.traffic metric shows the request received and the response sent at any time.
- A number of threads: By default, Tomcat servers create 200 threads; as the limit is reached, Tomcat continues accommodating a certain number of concurrent connections. However, keeping track of the total number of threads created is necessary. The tomcat.threads metric gives the total number of threads.
All metrics related to the categories above can be gathered with the JMX receiver – so let’s get started!
The first step in this configuration is to install observIQ’s distribution of the OpenTelemetry Collector. For installation instructions and the collector's latest version, check our GitHub repo.
Related Content: How to Install and Configure an OpenTelemetry Collector
Enabling JVM for Tomcat
Tomcat, by default, does not have JVM enabled. To enable JVM, follow the instructions linked here.
Configuring the jmxreceiver
After the installation, the config file for the collector can be found at:
- C:\Program Files\observIQ OpenTelemetry Collector\config.yaml (Windows)
- /opt/observiq-otel-collector/config.yaml(Linux)
The first step is the receiver’s configuration:
- We are using the JMX receiver to gather Tomcat metrics. The jar_path attribute lets you specify the path to the jar file, which facilitates gathering Tomcat metrics using the JMX receiver. This file path is created automatically when observIQ’s distribution of the OpenTelemetry Collector is installed.
- Set the IP address and port for the system from which the metrics are gathered as the endpoint.
- When we connect to JMX, there are different metrics categories; the Tomcat and JVM metrics are the ones that this configuration intends to scrape. This target_system attribute specifies that.
- Set the time interval for fetching the metrics for the collection_interval attribute. The default value for this parameter is 10s. However, if exporting metrics to Google Cloud operations, this value is set to 60s by default.
- The Properties attribute allows you to set arbitrary attributes. For instance, if you are configuring multiple JMX receivers to collect metrics from many Tomcat servers, this attribute will enable you to set the unique IP addresses for each endpoint system. Please note that this is not the only use of the properties option.
1receivers:
2 jmx:
3   jar_path: /opt/opentelemetry-java-contrib-jmx-metrics.jar
4   endpoint: localhost:9000
5   target_system: tomcat,jvm
6   collection_interval: 60s
7   properties:
8     # Attribute 'endpoint' will be used for generic_node's node_id field.
9 otel.resource.attributes: endpoint=localhost:9000The next step is to configure the processors:
- Use the resourcedetection processor to create an identifier value for each Tomcat system from which the metrics are scraped.
- Add the batch processor to bundle the metrics from multiple receivers. We highly recommend using this processor in the configuration, especially for the benefit of the collector's logging component. To learn more about this processor, check the documentation.
1processors:
2 resourcedetection:
3   detectors: ["system"]
4   system:
5     hostname_sources: ["os"]
6
7 batch:The next step is to set a destination for exporting the metrics, as shown below. You can check the configuration for your preferred destination from OpenTelemetry’s documentation here.
1exporters:
2 googlecloud:
3   retry_on_failure:
4 enabled: falseSet up the pipeline.
1service:
2 pipelines:
3   metrics:
4     receivers:
5     - jmx
6     processors:
7     - resourcedetection
8     - resourceattributetransposer
9     - resource
10     - batch
11     exporters:
12 - googlecloudViewing the metrics collected
Based on the above configuration, the JMX metrics gatherer scrapes the following metrics and exports them to Google Cloud Operations.
Related Content: Turning Logs into Metrics with OpenTelemetry and BindPlane OP
observIQ’s distribution is a game-changer for companies looking to implement the OpenTelemetry standards. The single-line installer, seamlessly integrated receivers, exporter, and processor pool make working with this collector simple. Follow this space to keep up with all our future posts and simplified configurations for various sources. For questions, requests, and suggestions, contact our support team at support@observIQ.com.


