Google Cloud Managed Service for Prometheus
Google Cloud Managed Service for Prometheus is Google Cloud's fully managed, multi-cloud, cross-project solution for Prometheus metrics.
important
🚧 This destination is compatible with Prometheus metrics only.
Supported Types
| Metrics | Logs | Traces |
|---|---|---|
| ✓ |
Limitations
The Google Managed Prometheus destination is intended to be used with Prometheus metrics, which can be received with the following sources:
- Prometheus
- OTLP
This limitation is due to Google requiring the following resource attributes:
- service.instance.id
- service.name
Google will translate those attributes into instance and job respectively.
When scraping a Prometheus exporter with the Prometheus source type, the required resource attributes are present automatically.
Any resource attributes that do not map up with Google's Prometheus target resource type will be removed from the metric. This can make it difficult to guarantee uniqueness between data points that were emitted from different sources.
See the following documentation for more information on how Google handles monitored resource types
Prerequisites
Network Requirements
The following Google Cloud APIs must be enabled
- Cloud Monitoring
The following network access is required between the BindPlane Agent and the following Google API endpoint URLs.
Metrics: metrics.
Metrics
Google Cloud Monitoring API v3: monitoring.googleapis.com:443
tip
👍 Typically, when sent telemetry from a GCP hosted system, these URLs are part of default network access.
Authentication
The Google Managed Prometheus destination supports two forms of authentication.
- Access Scopes
- Service Account
Google Cloud Access Scopes
When running within Google Cloud, you can configure your Compute Engine instances with the following access scopes, allowing the Google Managed Prometheus destination to configure authentication automatically.
- monitoring.write
You can read more about access scopes here.
Service Account
If running outside of Google Cloud, or within Google Compute Engine without access scopes, you can create a service account for authentication.
- Create a Google service account following this documentation.
- Assign your service account the following roles
- Monitoring Metric Writer
- Create and download a Service Account Access Key following this documentation.
The downloaded access key will be used when configuring the Google Cloud destination.
Configuration Table
| Parameter | Type | Default | Description |
|---|---|---|---|
| project | string | The Google Cloud Project ID to send logs, metrics, and traces to. | |
| auth_type | enum | auto | The method used for authenticating to Google Cloud. 'auto' will attempt to use the collector's environment, useful when running on Google Cloud or when you have set GOOGLE_APPLICATION_CREDENTIALS in the collector's environment. 'json' takes the JSON contents of a Google Service Account's credentials file. 'file' is the file path to a Google Service Account credential file. |
| credentials | string | JSON value from a Google Service Account credential file. | |
| credentials_file | string | Path to a Google Service Account credential file on the collector system. The collector's runtime user must have permission to read this file. | |
| default_location | enum | us-central1 | Google Managed Prometheus requires a "location" resource attribute. This parameter inserts the resource attribute if it does not already exist. |
Supported Retry and Queuing Settings
This destination supports the following retry and queuing settings:
| Sending Queue | Persistent Queue | Retry on Failure |
|---|---|---|
| ✓ | ✓ | ✓ |
Example Configurations
Automatic Authentication
This example uses the auto Authentication Method. When running within Google Cloud with the correct access scopes, the destination will perform automatic authentication and send metrics, traces, and logs to the project bindplane-gcp.

Service Account Credentials (JSON)
BindPlane OP can embed credentials into the agent configuration when the authentication method json is selected.
When using the json option, paste the service account JSON key into the text box. This method is convenient as it does not require copying the service account key on the agent system.

Service Account Credentials (File)
If you would prefer to copy the service account key to the agent system instead of having BindPlane handle it, you can select the file option. In this example, the service account access key file is located at /opt/observiq-otel-collector/service_account.json.

Usage
Create a configuration with the Prometheus source and Google Managed Prometheus destination.
As an example, you can target the agent's metrics port, 8888.

Configure the destination to point to your Google Cloud project, and add your service account credentials.
The finished configuration will have a Prometheus source, and Google Managed Prometheus destination. You can add processors to add, remove, and modify metrics. Next, add at least one agent and rollout the configuration.

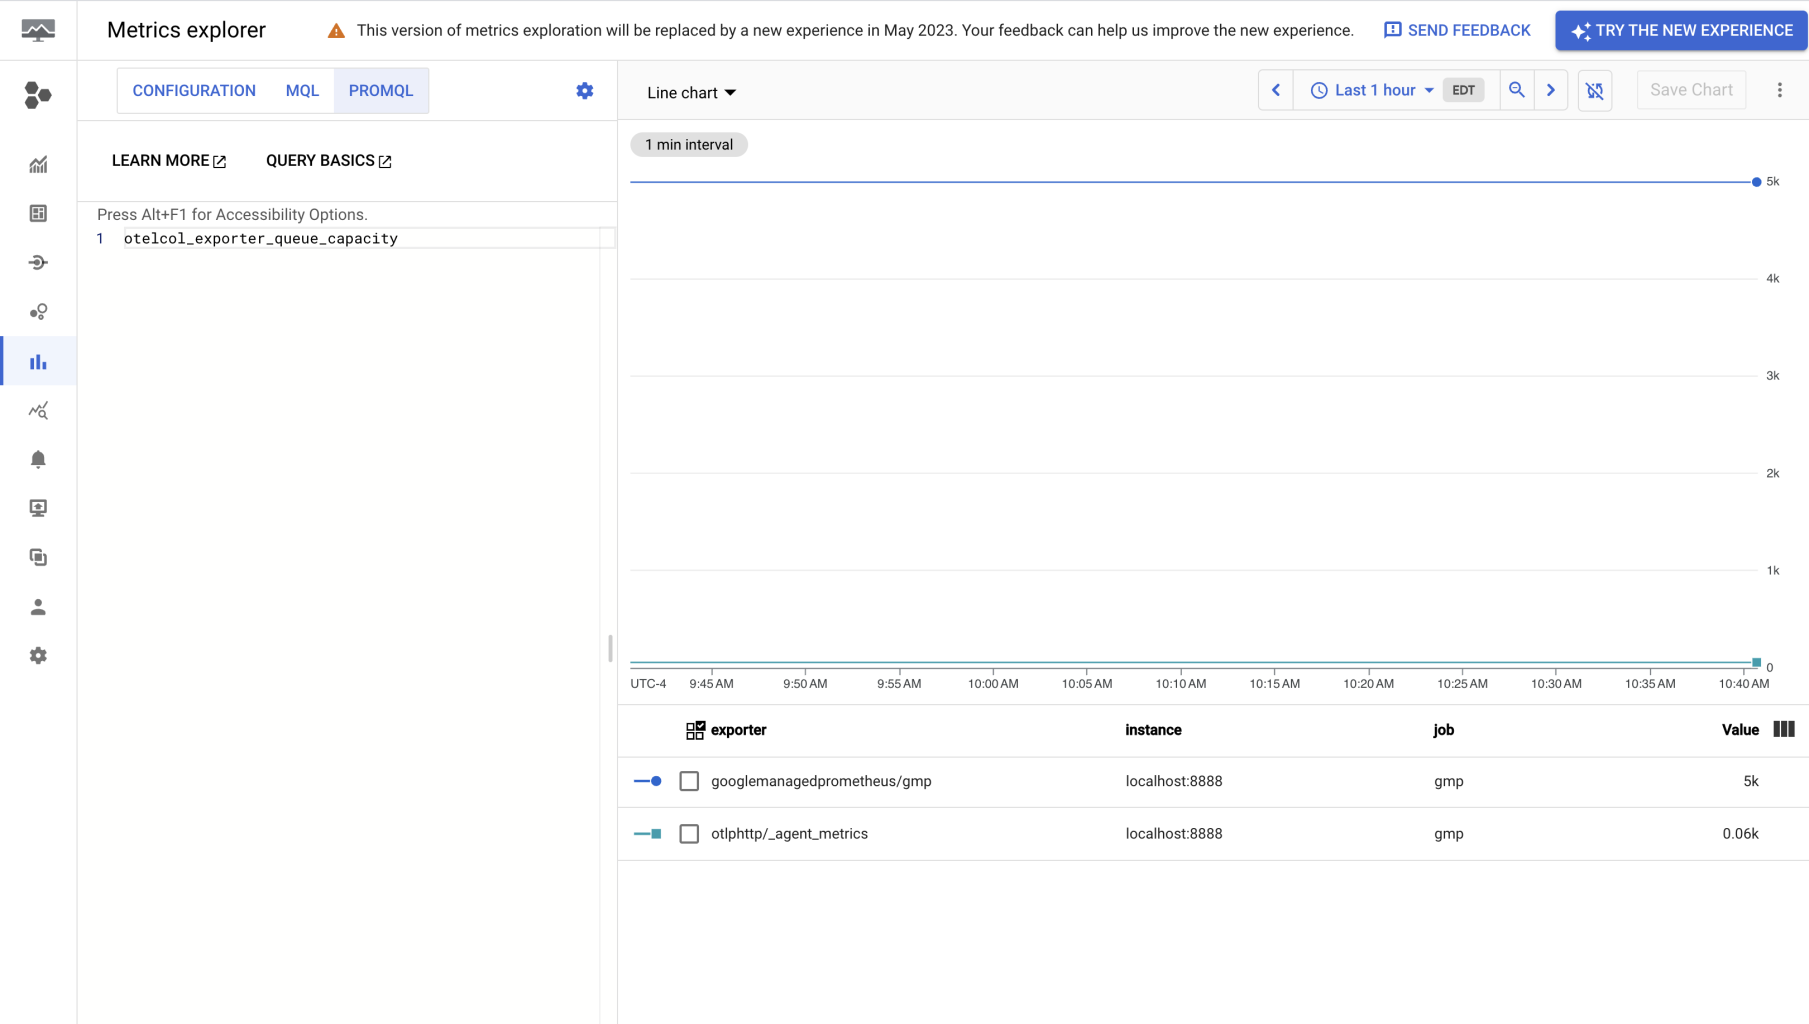
In Cloud Monitoring, search for "Prometheus Target" using the metrics explorer.
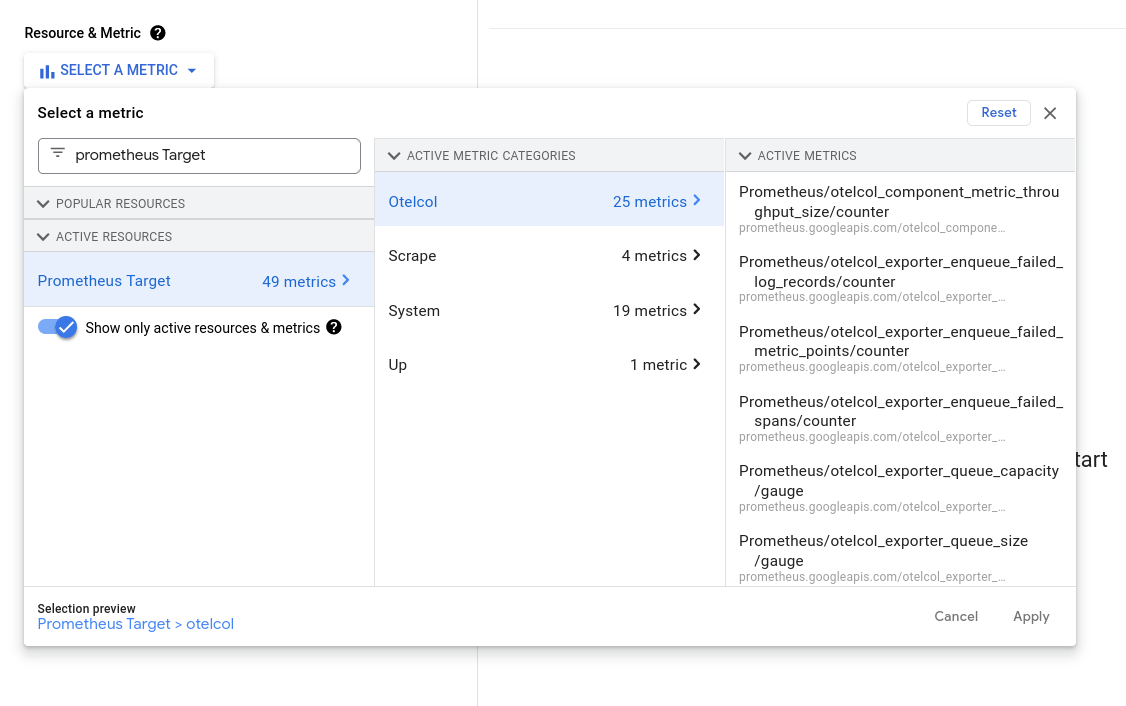
Select a metric and note that the job, service_instance_idand service_name metric labels can be used to identify which agent the metric originates from.