Microsoft 365
Note:
Instructions for configuring your Microsoft 365 tenant are included at the bottom of this document, but here are a few important notes to acknowledge.
After configuring this source, both metrics and logs will take some time to become available.
- Metrics are reported by the API every 24 hours, with each report containing the metrics that were created two days prior. This means metrics generated on June 25 will appear to be from June 27. The receiver scrapes every hour, but note that data points collected within the same 24-hour reporting interval will be duplicates.
- Logs require an extra step the first time the tenant is configured for logs. Instructions are included at the bottom of this document. After this configuration step, it will take up to 60 minutes for logs to be enabled - do not run the receiver until this finishes. It may take up to 12 hours for logs to be made available by the API, after they have been enabled. After that point, logs will typically take 0-3 hours to be reported after being generated, but there is no guarantee given by the API.
Finally, note that the client secret used to connect will expire (recommended 180 days) and needs to be re-generated, and your source will need to be reconfigured with the new client secret. The initial delay for logs will not be repeated upon reconfiguration.
Supported Platforms
| Platform | Metrics | Logs | Traces |
|---|---|---|---|
| Linux | ✓ | ✓ | |
| Windows | ✓ | ✓ | |
| macOS | ✓ | ✓ |
Prerequisites
- Created instance of Microsoft 365 with the following subscriptions: Microsoft 365 Business Basic, Microsoft 365 E5 Compliance, and Microsoft 365 E3 (Works with the respective "upgraded" versions as well.)
- Access to an Admin account for the instance of 365 to be monitored.
Metrics
| Metric | Unit | Description | Attribute Values |
|---|---|---|---|
| m365.onedrive.files.active.count | {files} | The number of active files across the OneDrive in the last seven days. | |
| m365.onedrive.files.count | {files} | The number of total files across the OneDrive for the last seven days. | |
| m365.onedrive.user_activity.count | {users} | The number of users who have interacted with a OneDrive file, by action in the last seven days. | activity: view_edit, synced, internal_share, external_share |
| m365.outlook.app.user.count | {users} | The number of unique users per app over the period of time in the organization Outlook in the last seven days. | app: pop3, imap4, smtp, windows, mac, web, mobile, other_mobile |
| m365.outlook.email_activity.count | {emails} | The number of email actions by members over the period of time in the organization Outlook. | activity: read, sent, received |
| m365.outlook.mailboxes.active.count | {mailboxes} | The number of mailboxes that have been active each day in the organization for the last seven days. | |
| m365.outlook.quota_status.count | {mailboxes} | The number of mailboxes in the various quota statuses over the period of time in the org in the last seven days. | state: under_limit, warning, send_prohibited, send_receive_prohibited, indeterminate |
| m365.outlook.storage.used | By | The amount of storage used in Outlook by the organization in the last seven days. | |
| m365.sharepoint.files.active.count | {files} | The number of active files across all sites in the last seven days. | |
| m365.sharepoint.files.count | {files} | The number of total files across all sites in the last seven days. | |
| m365.sharepoint.pages.unique.count | {views} | The number of unique views of pages across all sites in the last seven days. | |
| m365.sharepoint.pages.viewed.count | {pages} | The number of unique pages viewed across all sites in the last seven days. | |
| m365.sharepoint.site.storage.used | By | The amount of storage used by all sites across SharePoint in the last seven days. | |
| m365.sharepoint.sites.active.count | {sites} | The number of active sites across SharePoint in the last seven days. | |
| m365.teams.calls.count | {calls} | The number of MS Teams calls from users in the organization in the last seven days. | |
| m365.teams.device_usage.users | {users} | The number of unique users by device/platform that used Teams in the last seven days. | device: Android, iOS, Mac, Windows, Chrome OS, Linux, Web |
| m365.teams.meetings.count | {meetings} | The number of MS Teams meetings for users in the organization in the last seven days. | |
| m365.teams.messages.private.count | {messages} | The number of MS Teams private-messages sent by users in the organization in the last seven days. | |
| m365.teams.messages.team.count | {messages} | The number of MS Teams team-messages sent by users in the organization in the last seven days. |
Source Configuration Table
| Parameter | Type | Default | Description |
|---|---|---|---|
| telemetry_types | telemetrySelector | ["Logs", "Metrics"] | Choose Telemetry Type. |
| tenant_id* | string | Identifies the instance of Microsoft 365 to be monitored. | |
| client_id* | string | Identifier this receiver will use when monitoring. | |
| client_secret* | string | The private key this receiver will use when monitoring must belong to the given Client ID. | |
| poll_interval | duration | 5m | Sets how often (minutes) to collect logs. |
| collection_interval | duration | 1h | Sets how often (hours) to scrape for metrics. |
Example Source Configuration


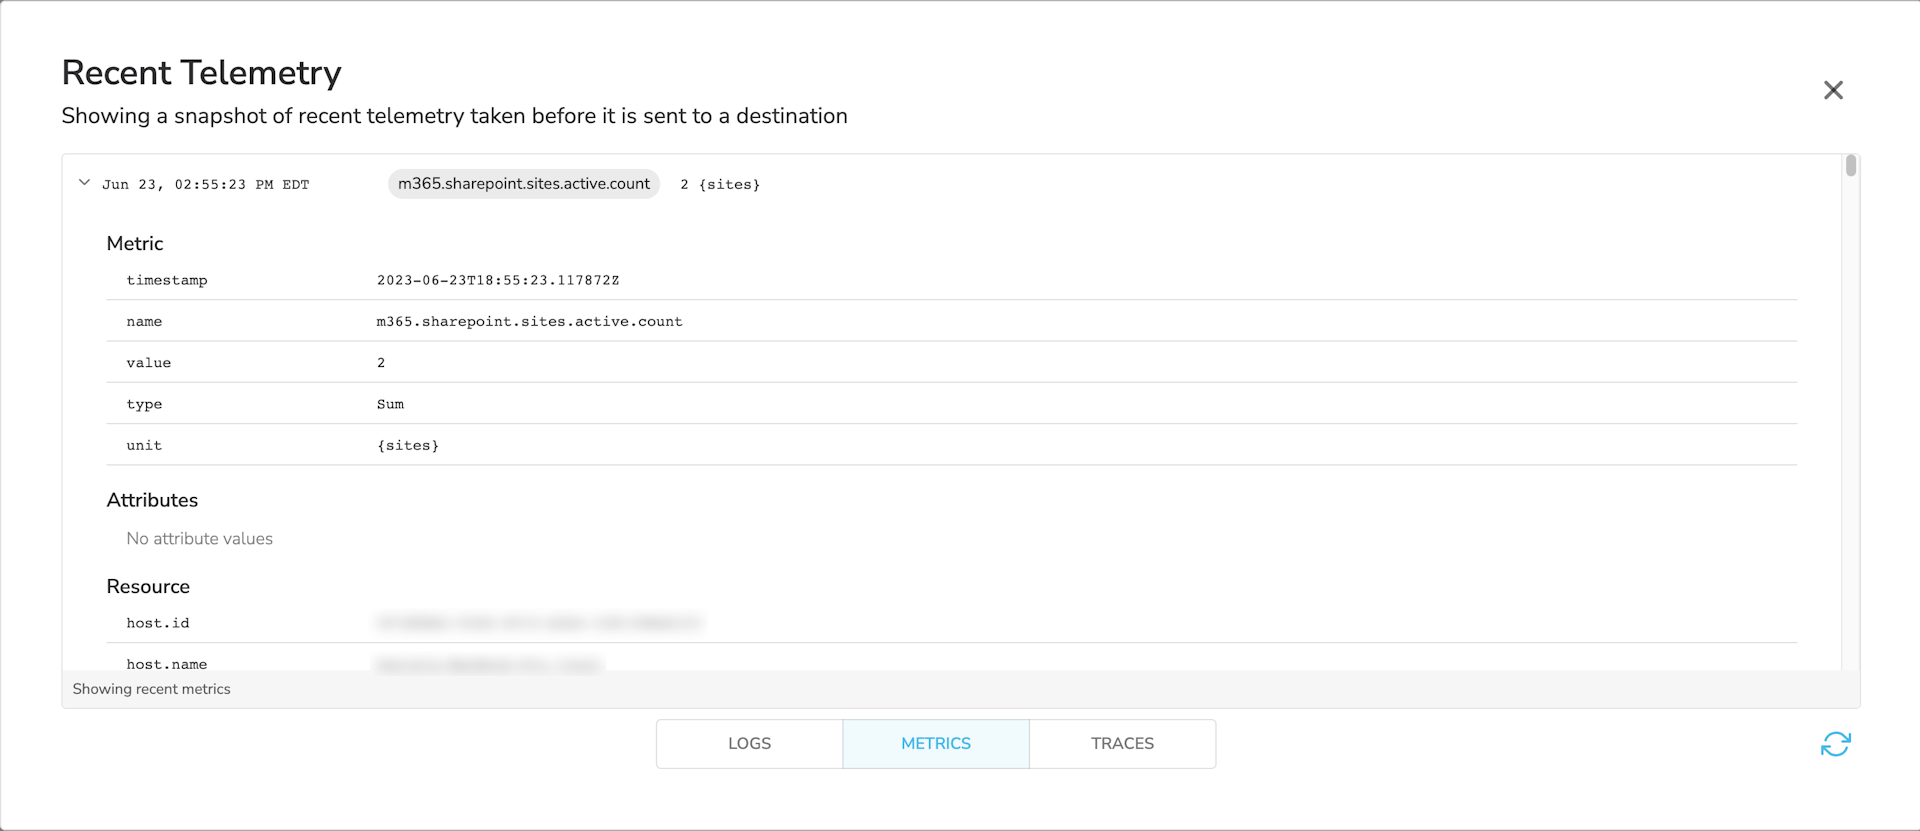
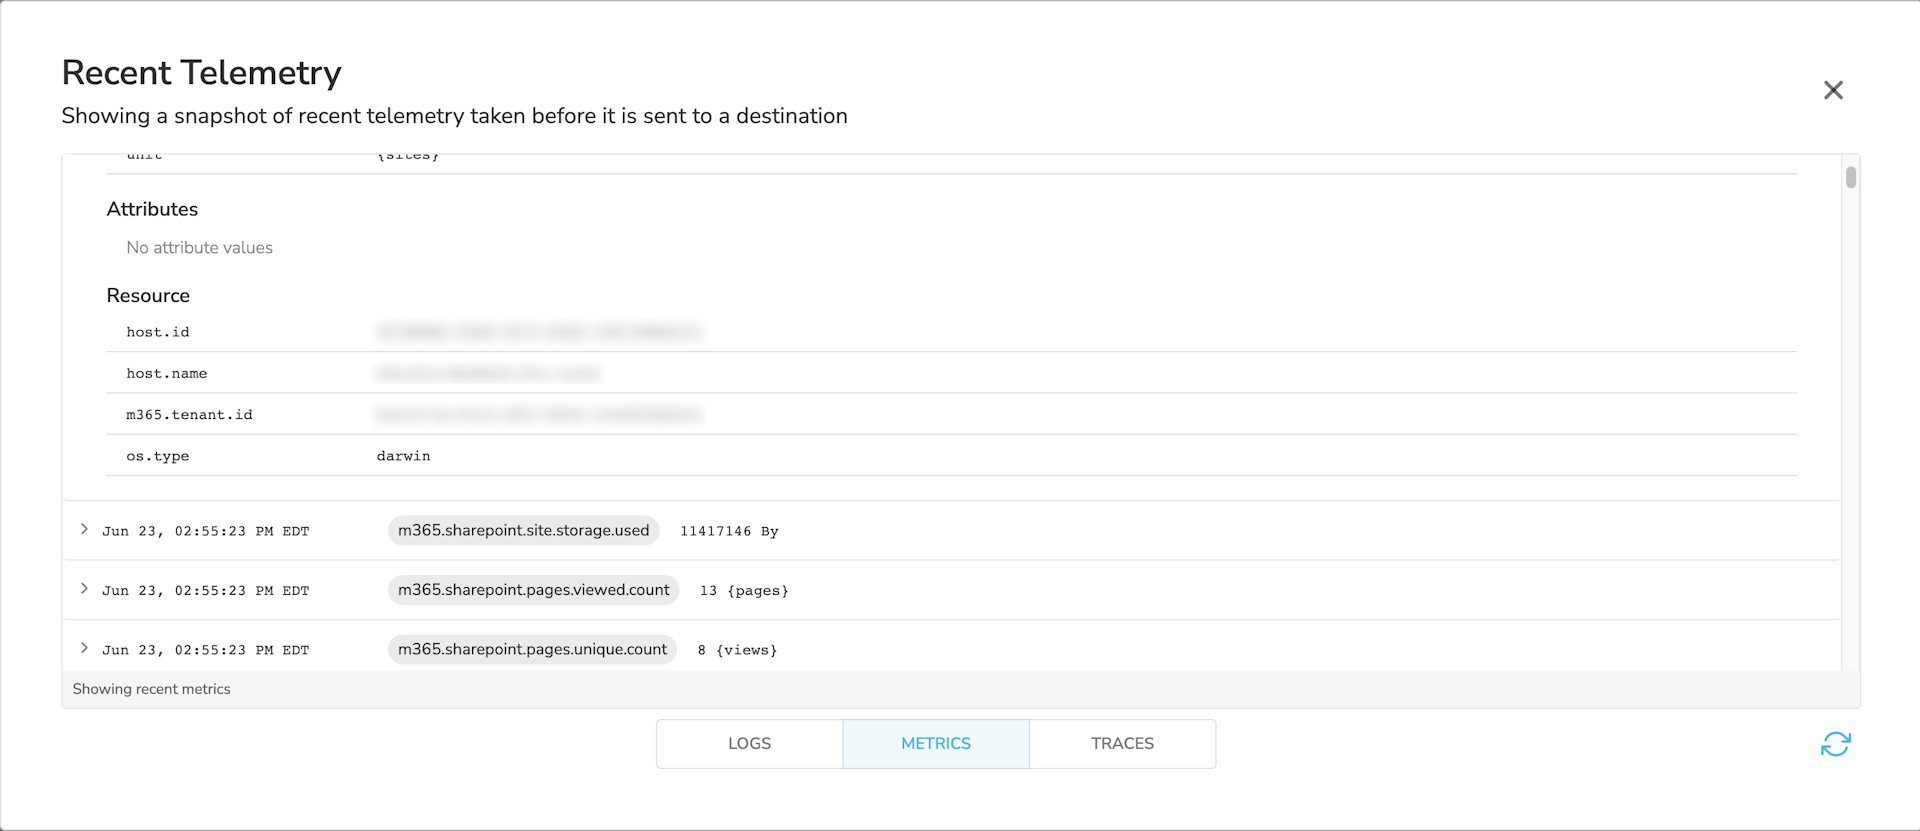
Once running on an agent, metrics will look like this:
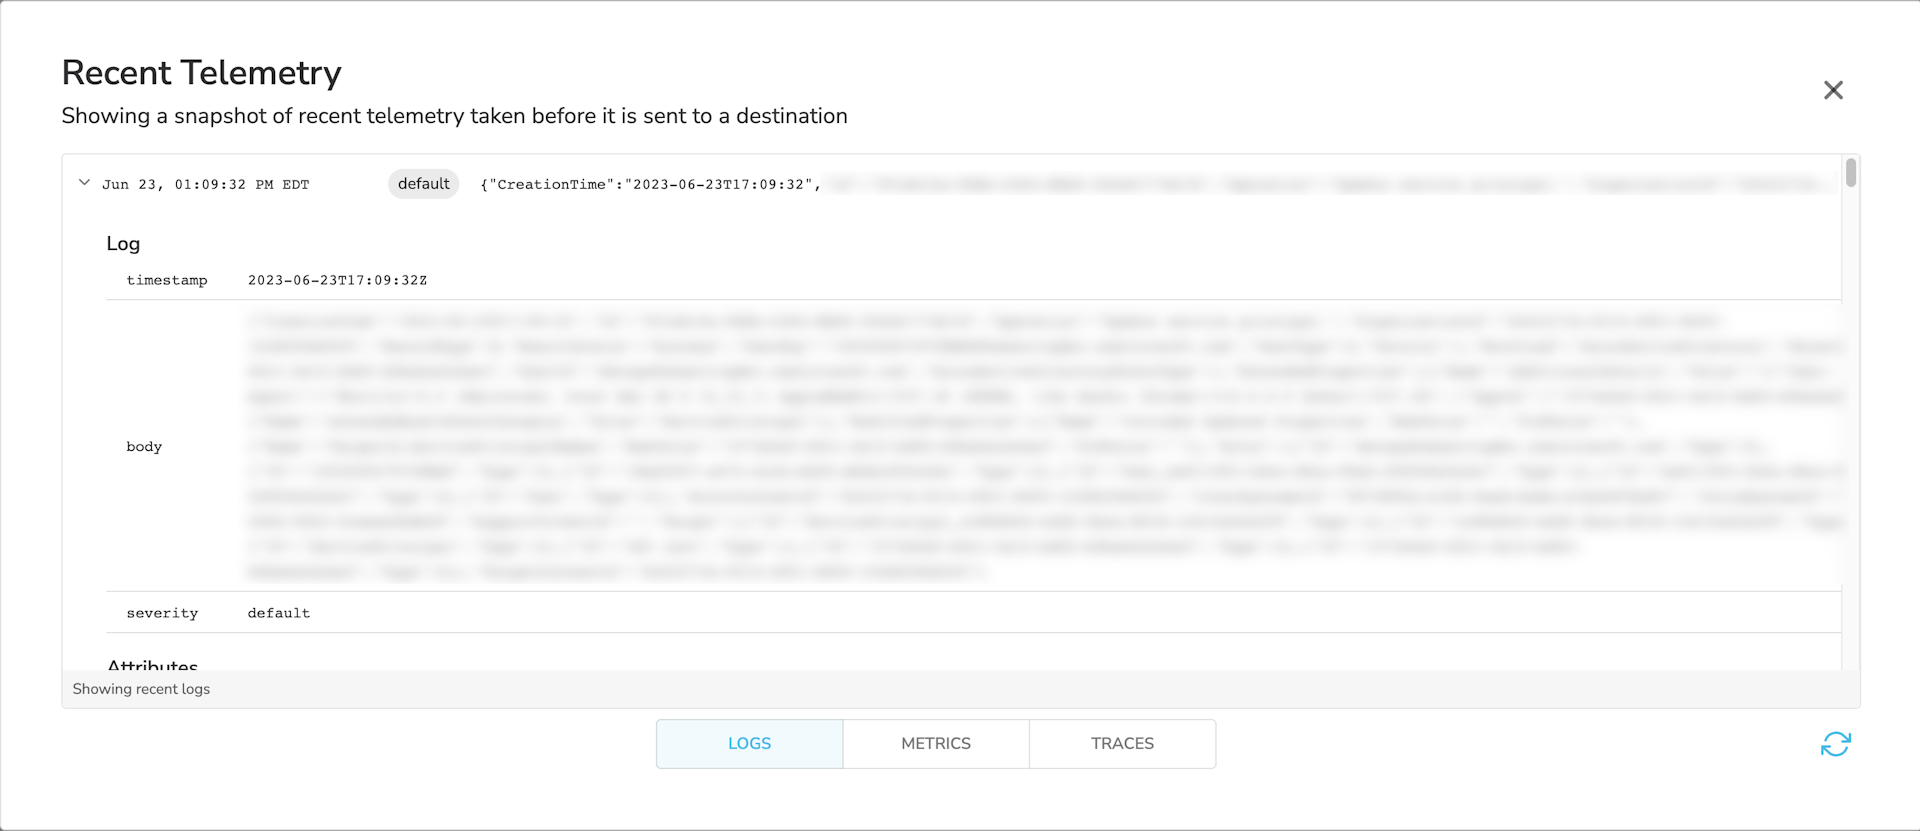
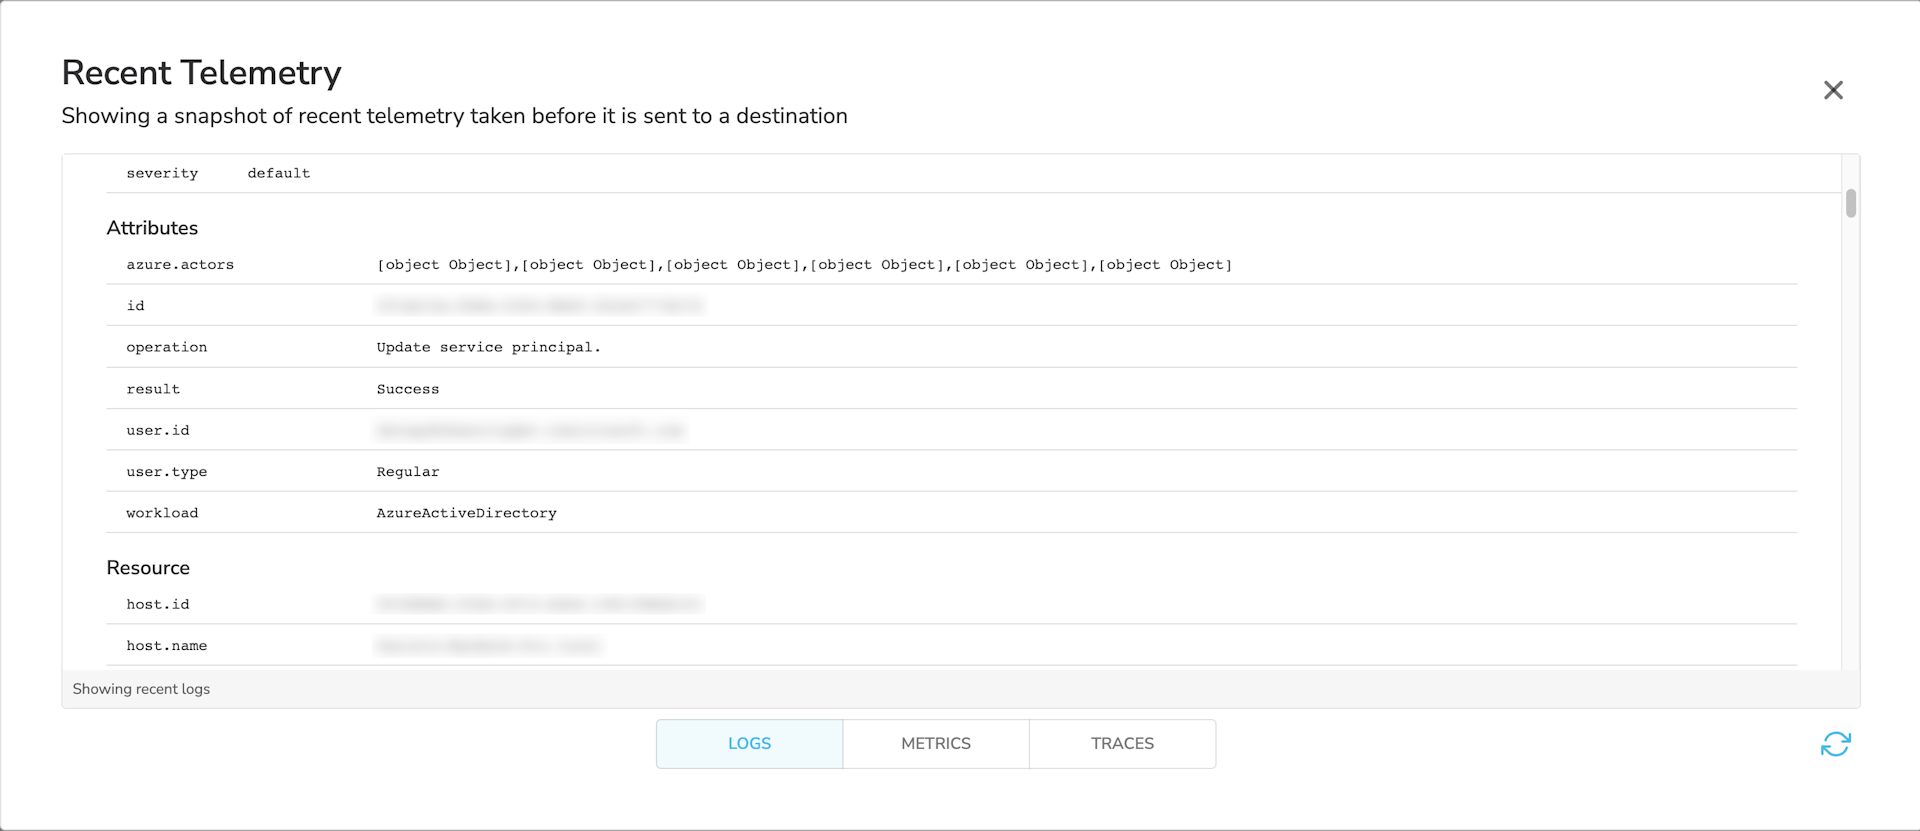
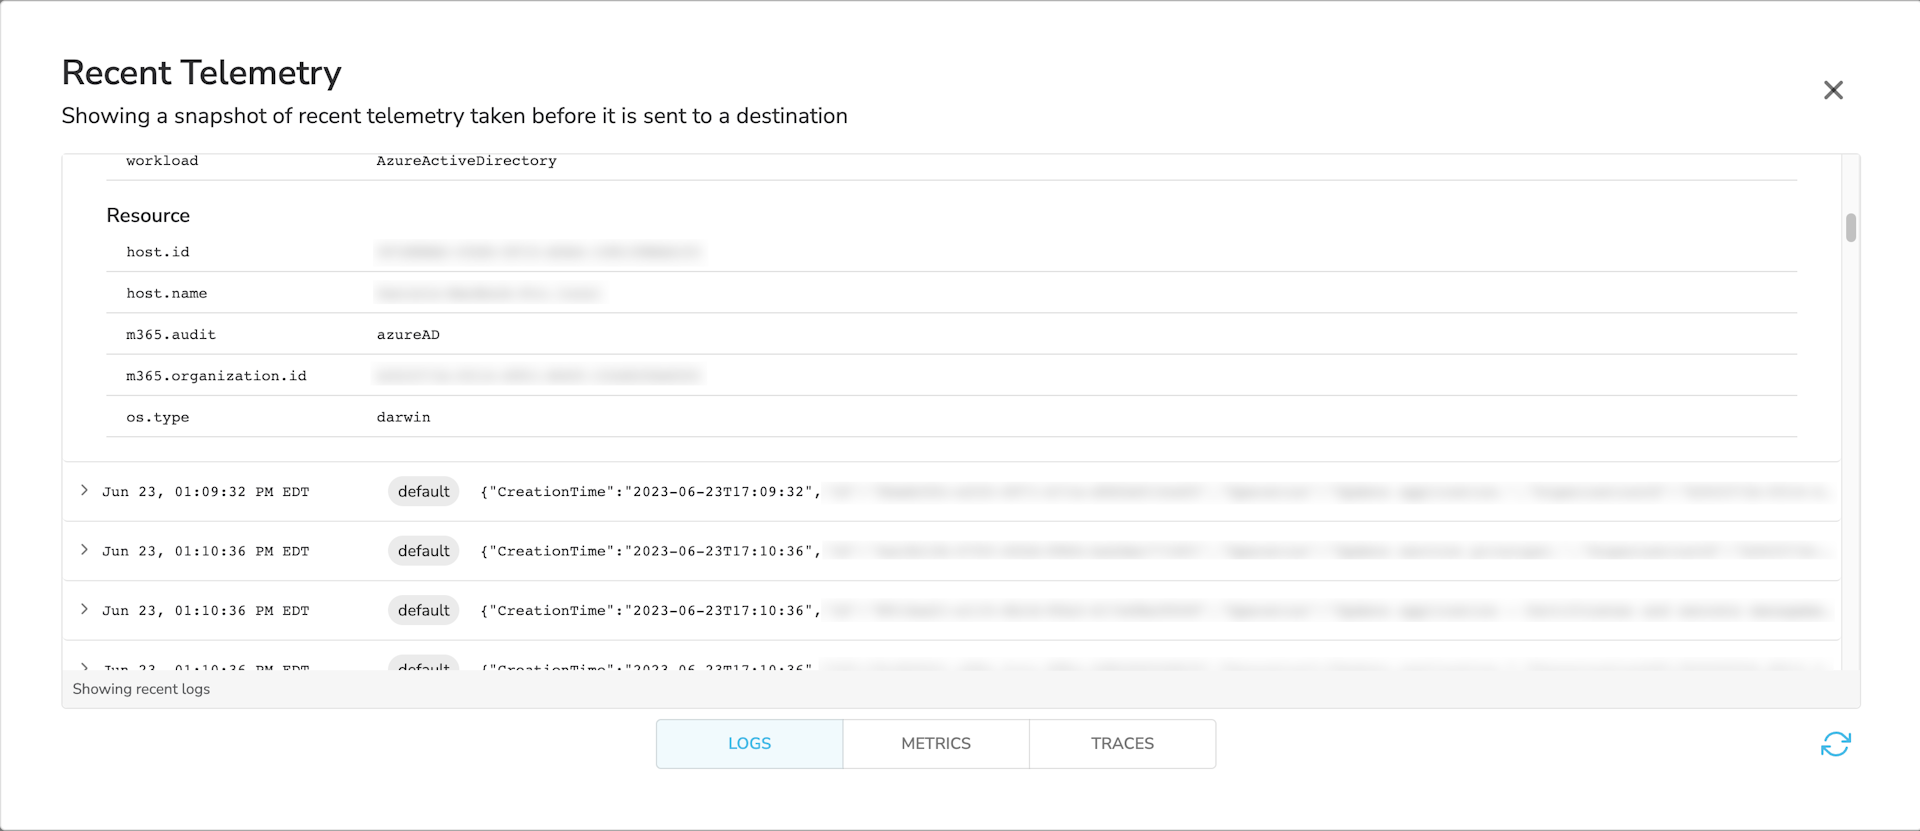
And logs will look like this:
Configuring Microsoft 365
The steps below outline how to configure Microsoft 365 to allow the receiver to collect metrics from the tenant to be monitored.
-
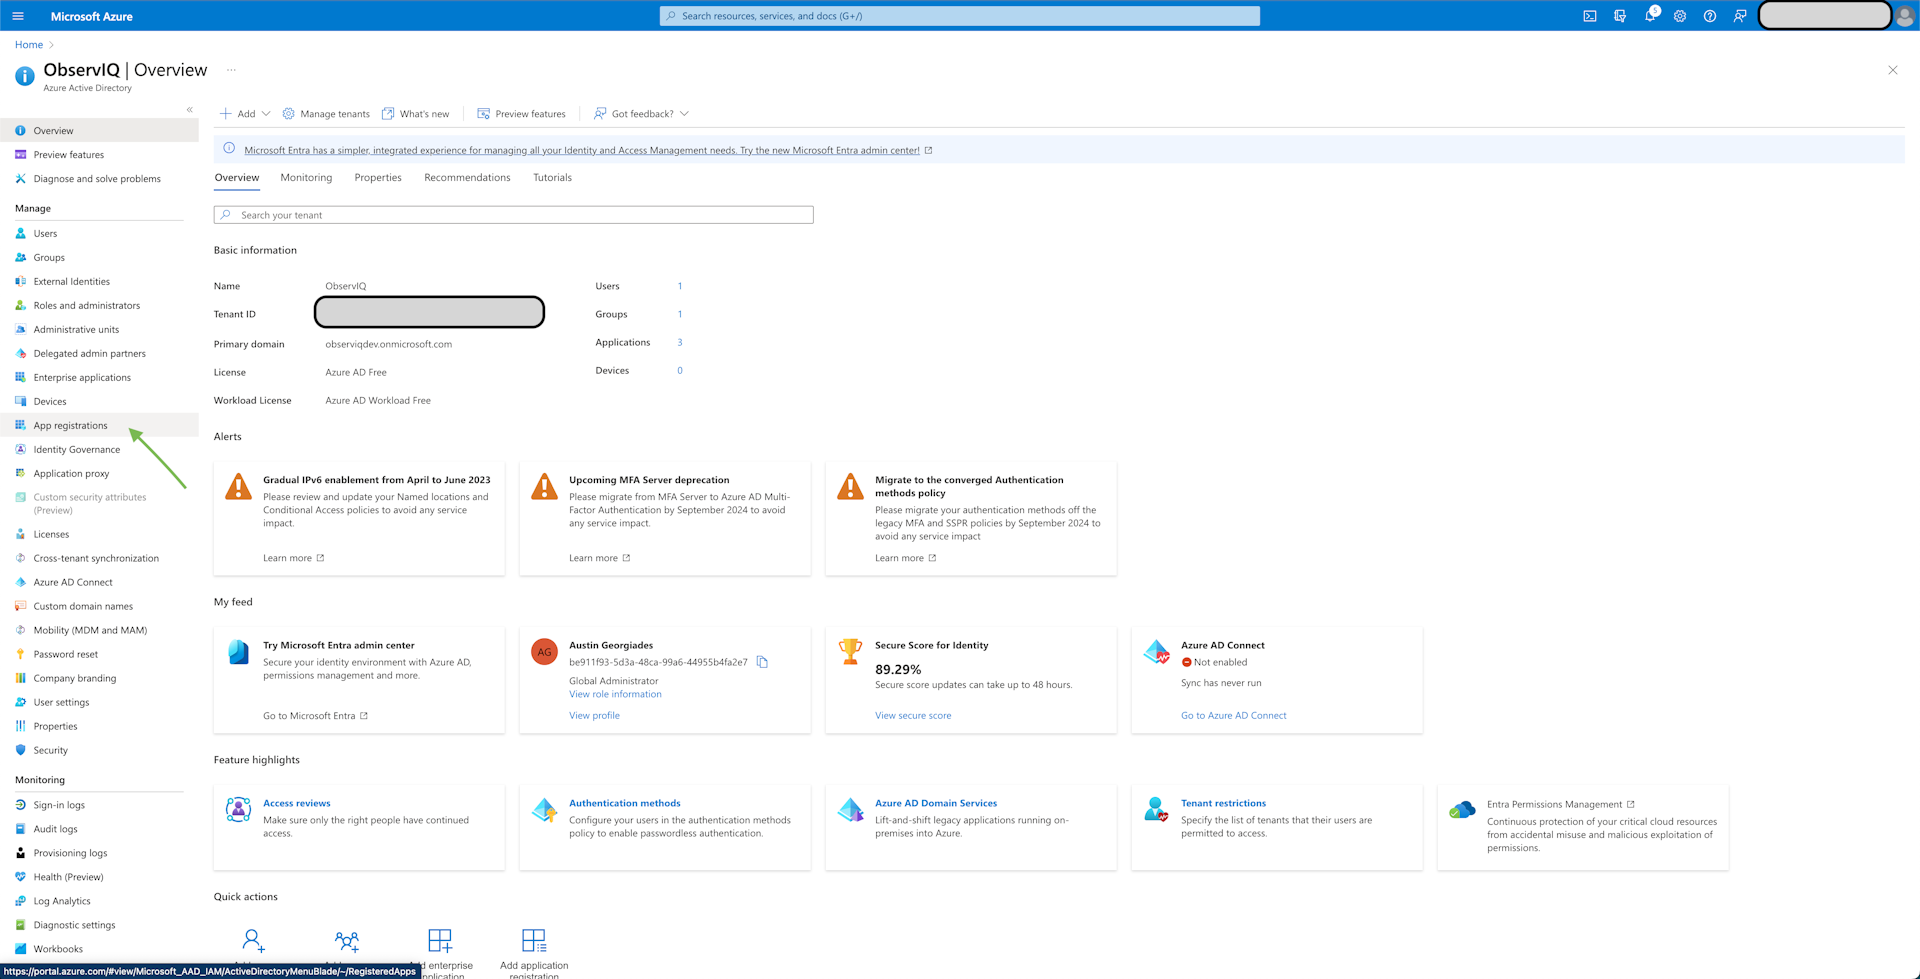
Login to Azure: Log in to Microsoft Azure under an Admin account for the instance of 365 to be monitored.
-
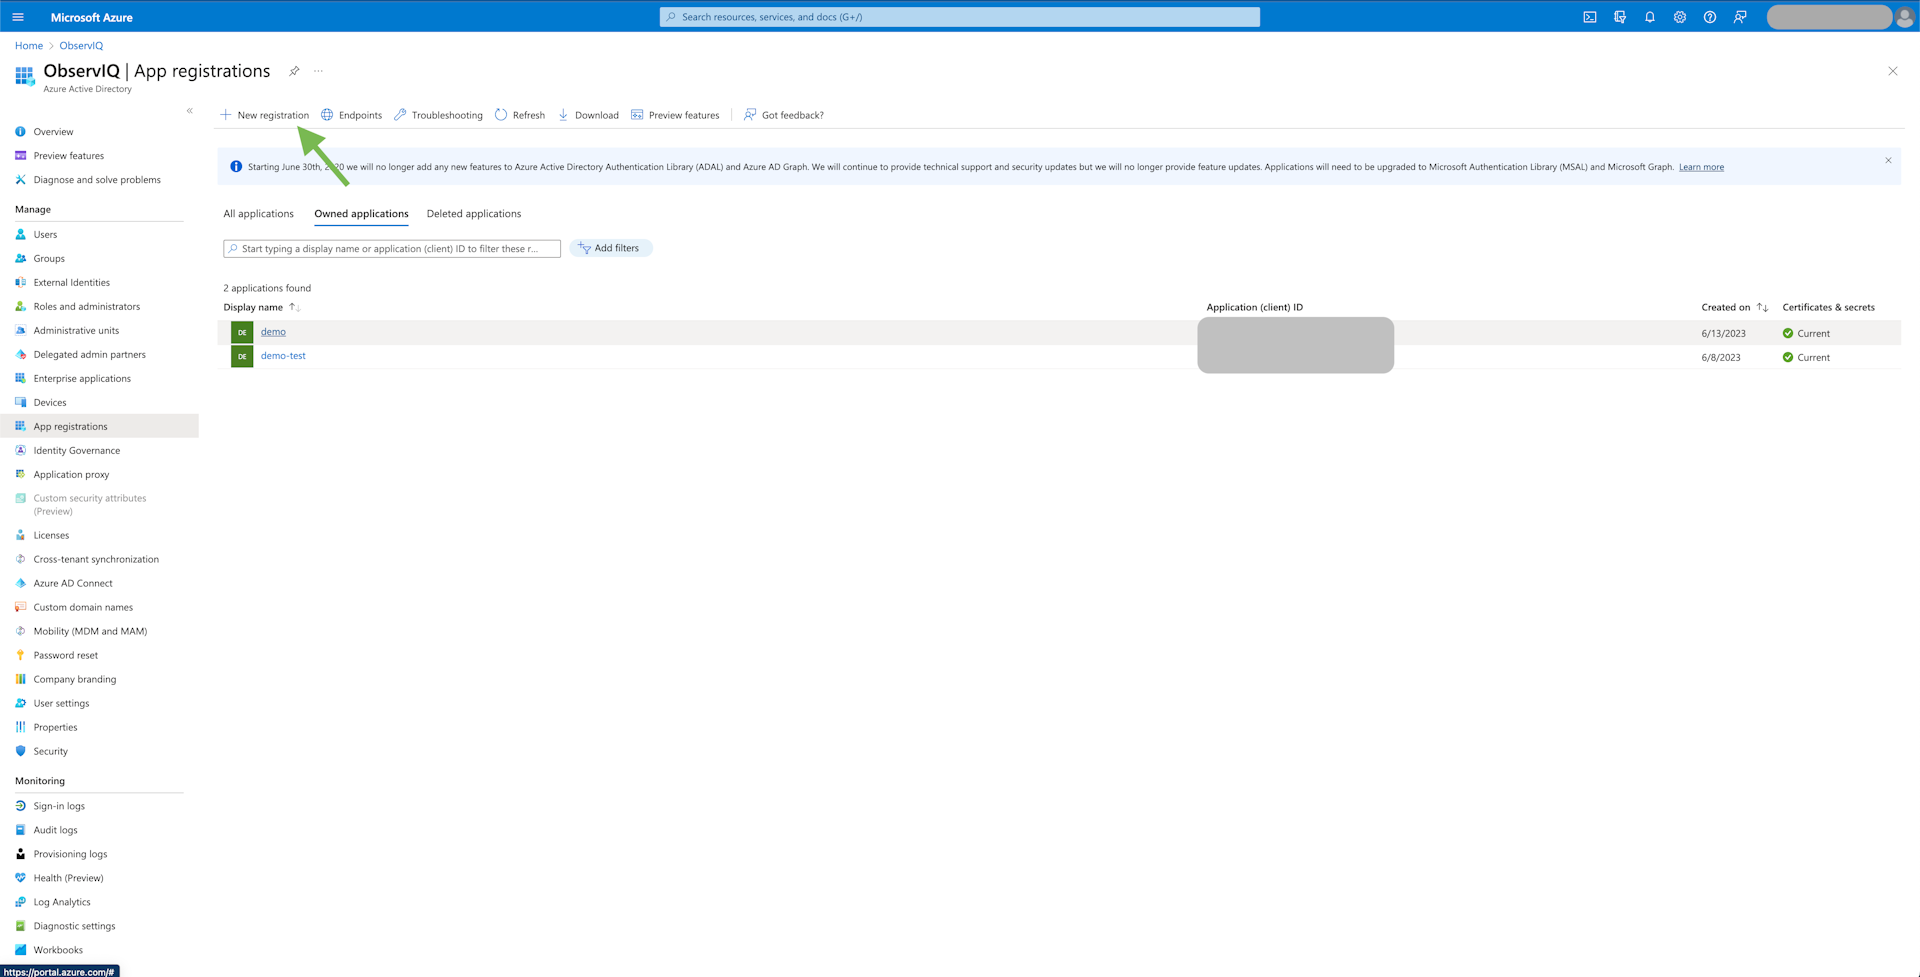
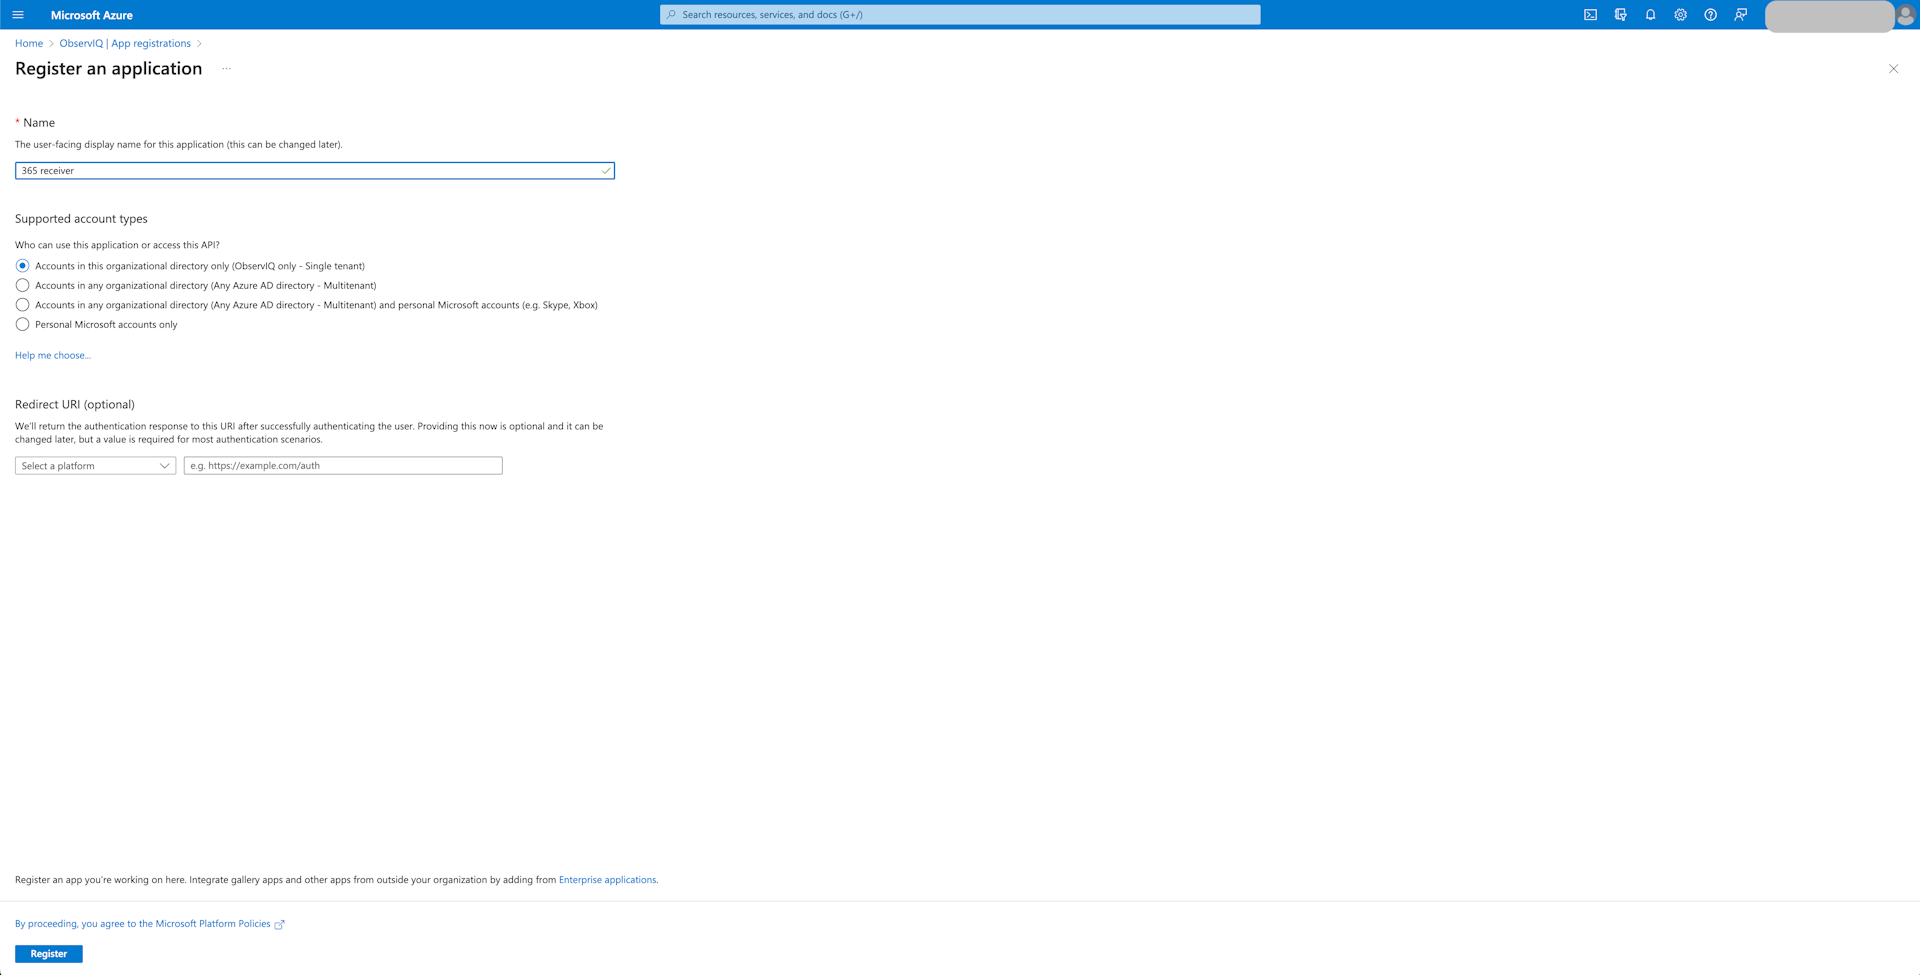
Register the receiver in Azure AD: Navigate to Azure Active Directory. Then go to "App Registrations" and select "New Registration".
Give the app a descriptive name like "365 Receiver". For "Supported account types", select the Single Tenant option and leave the Redirect URL empty.
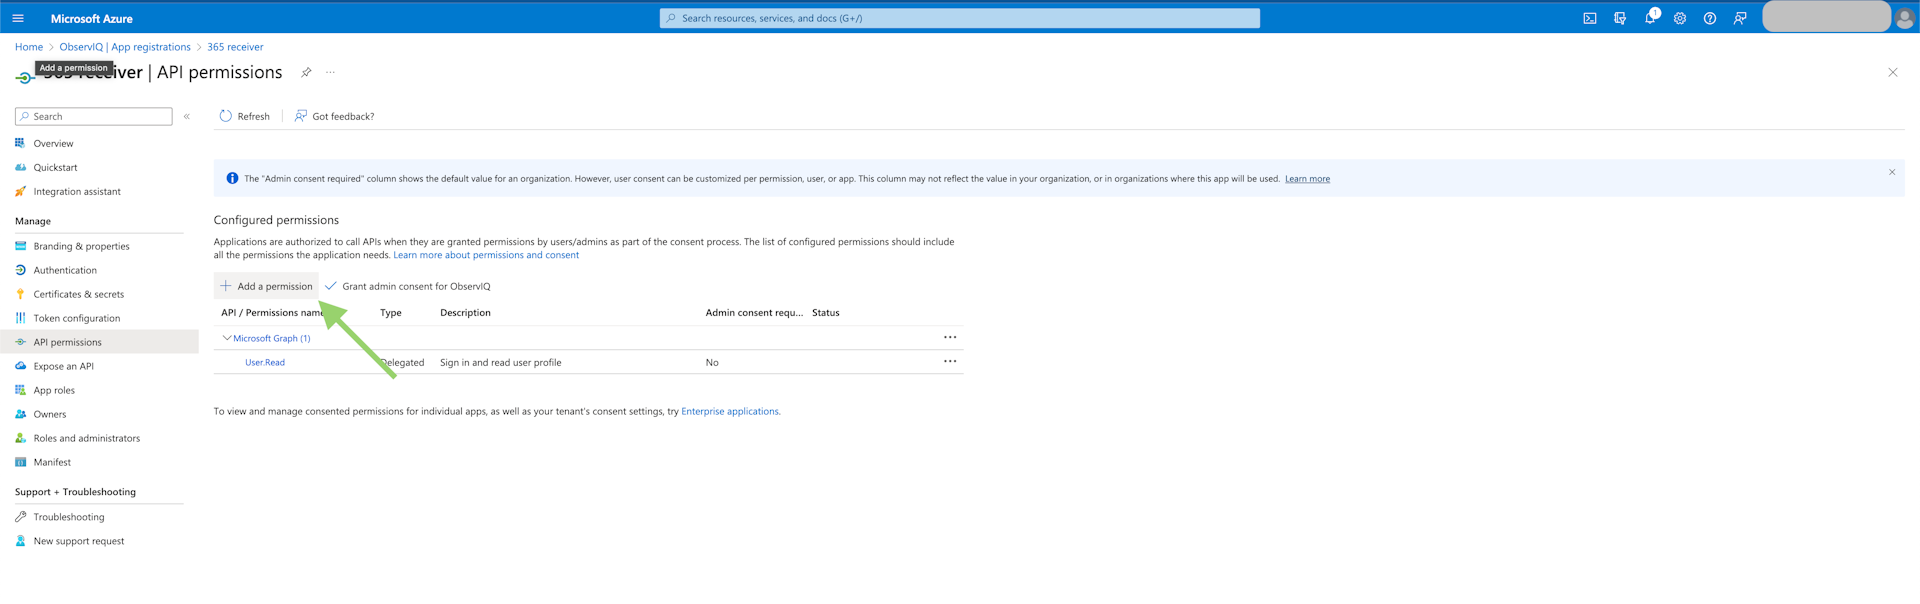
-
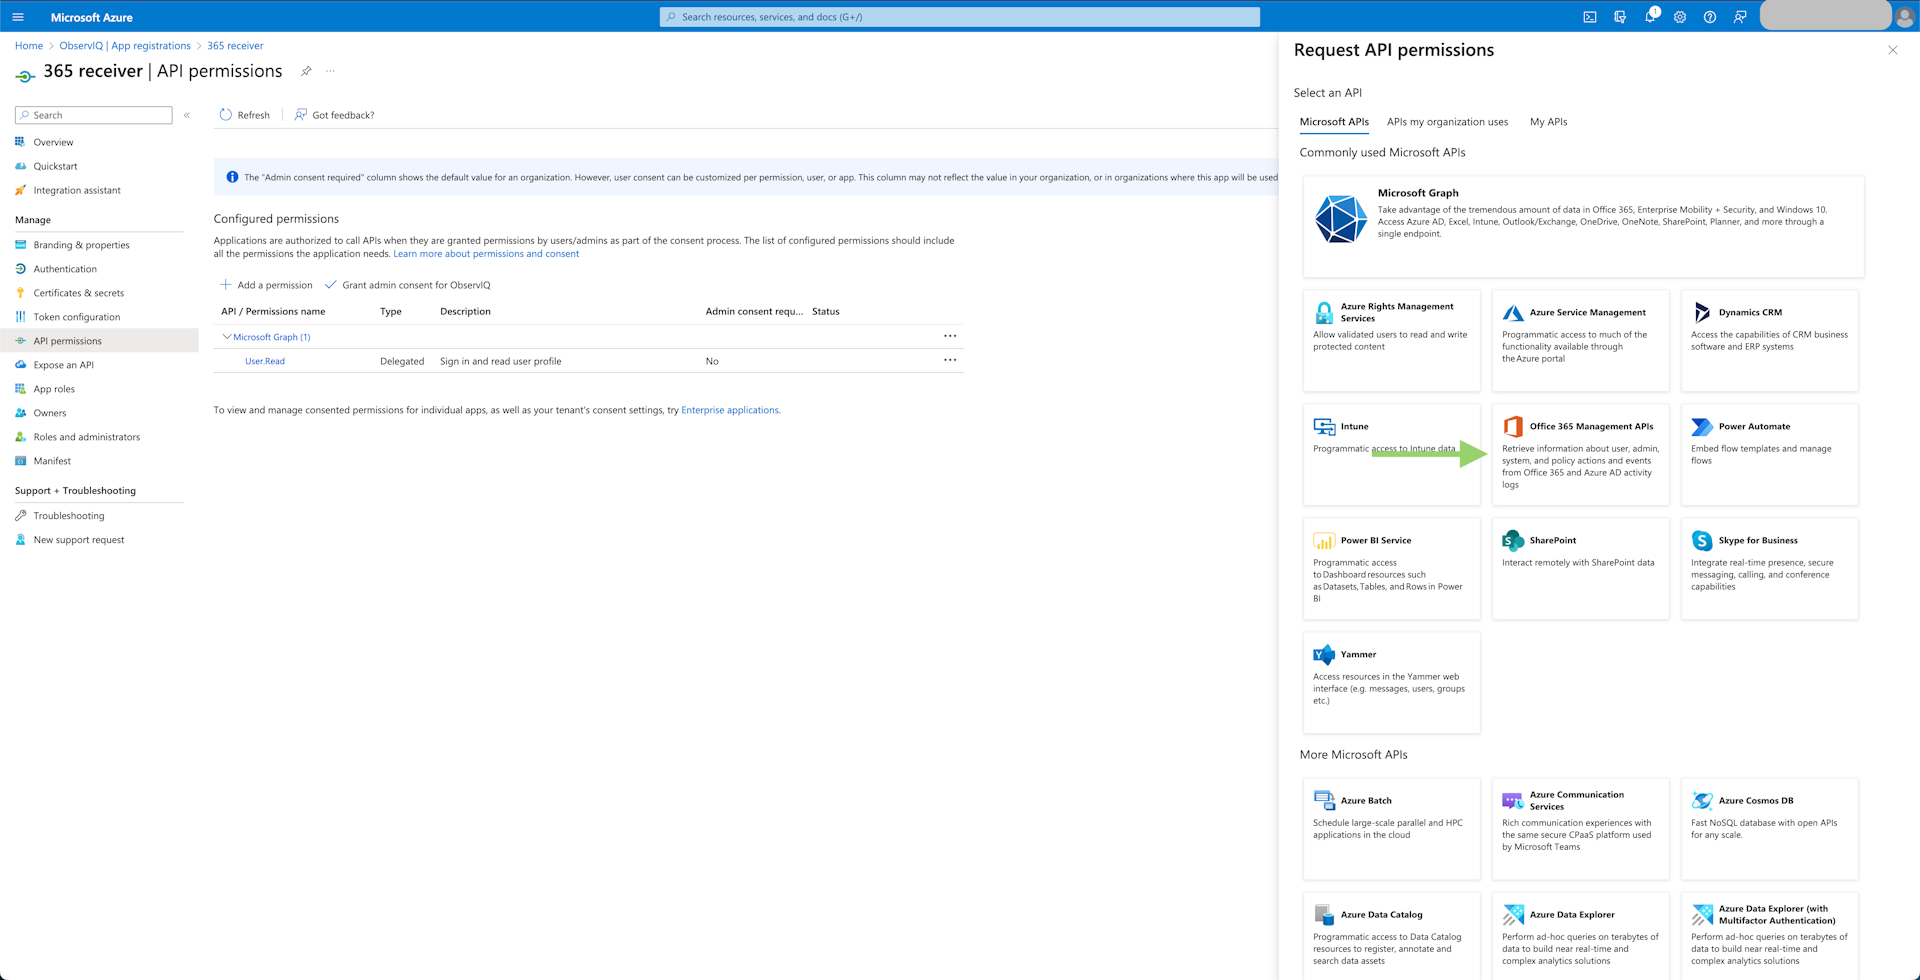
Add API Permissions: Select "View API Permissions" beneath the general application info and click "Add Permissions". The permissions needed for metrics and logs differ, so whichever monitoring is necessary, the respective permissions are outlined below.
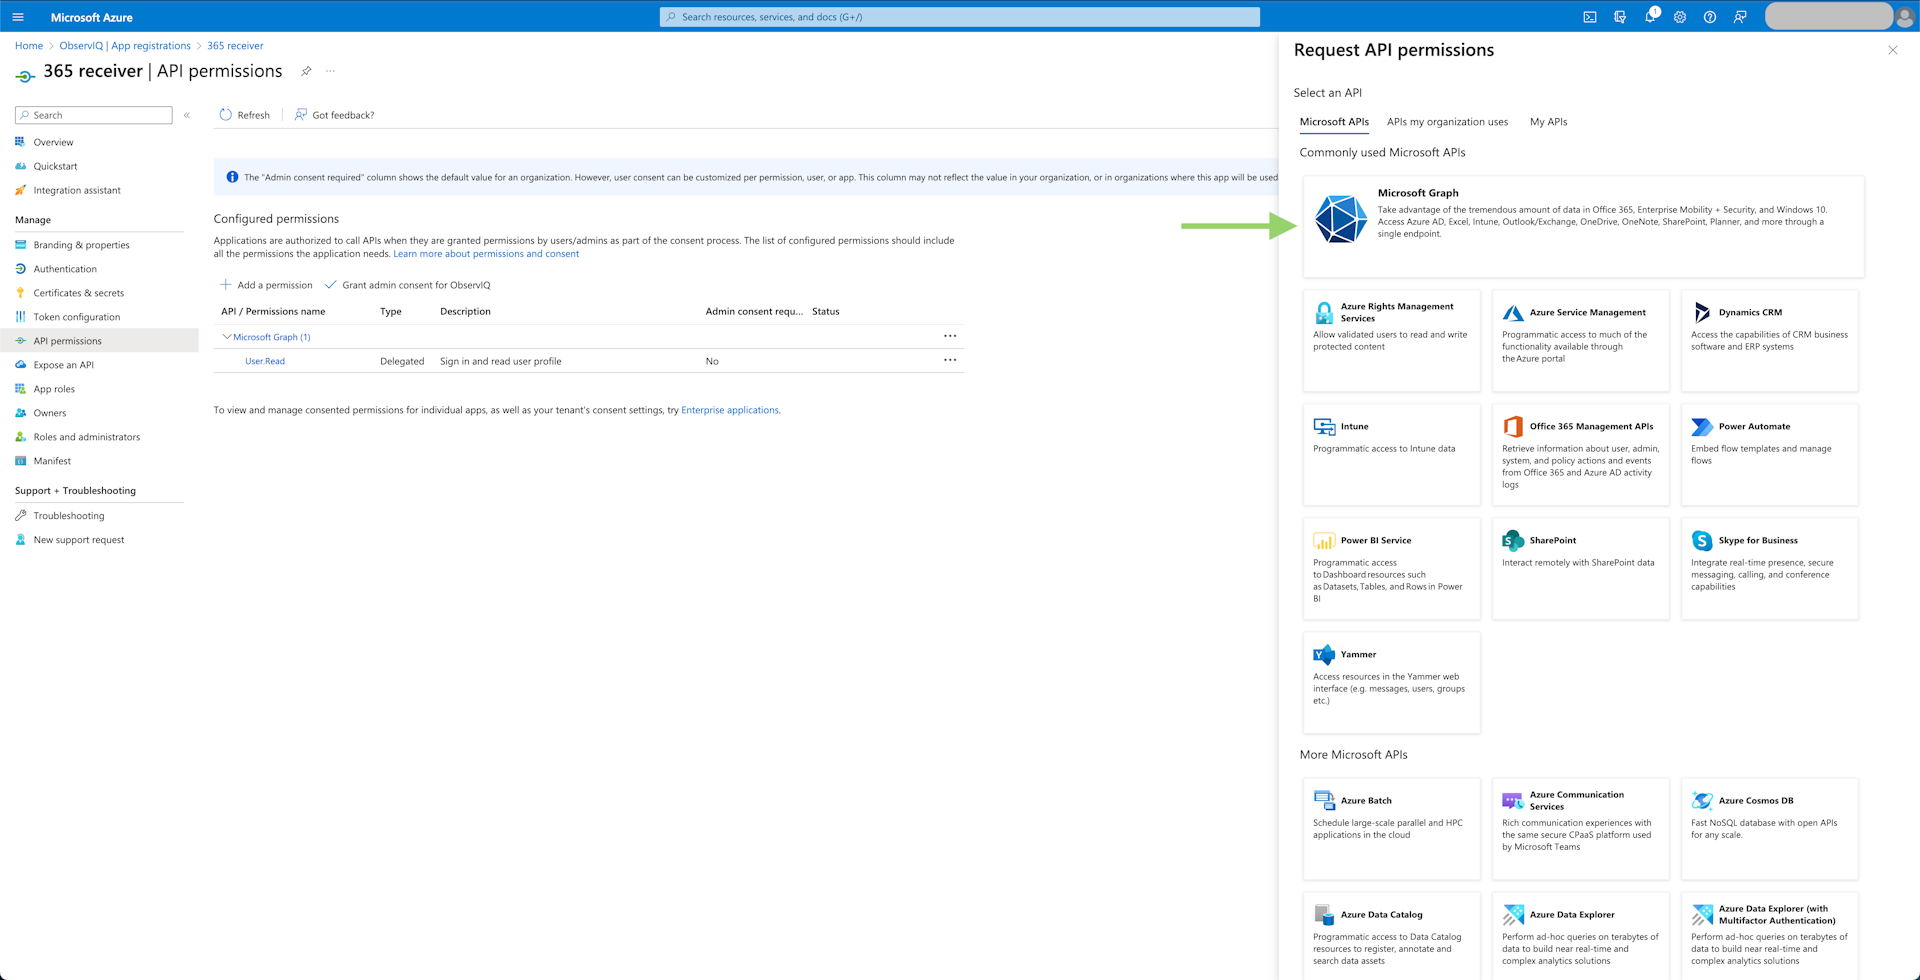
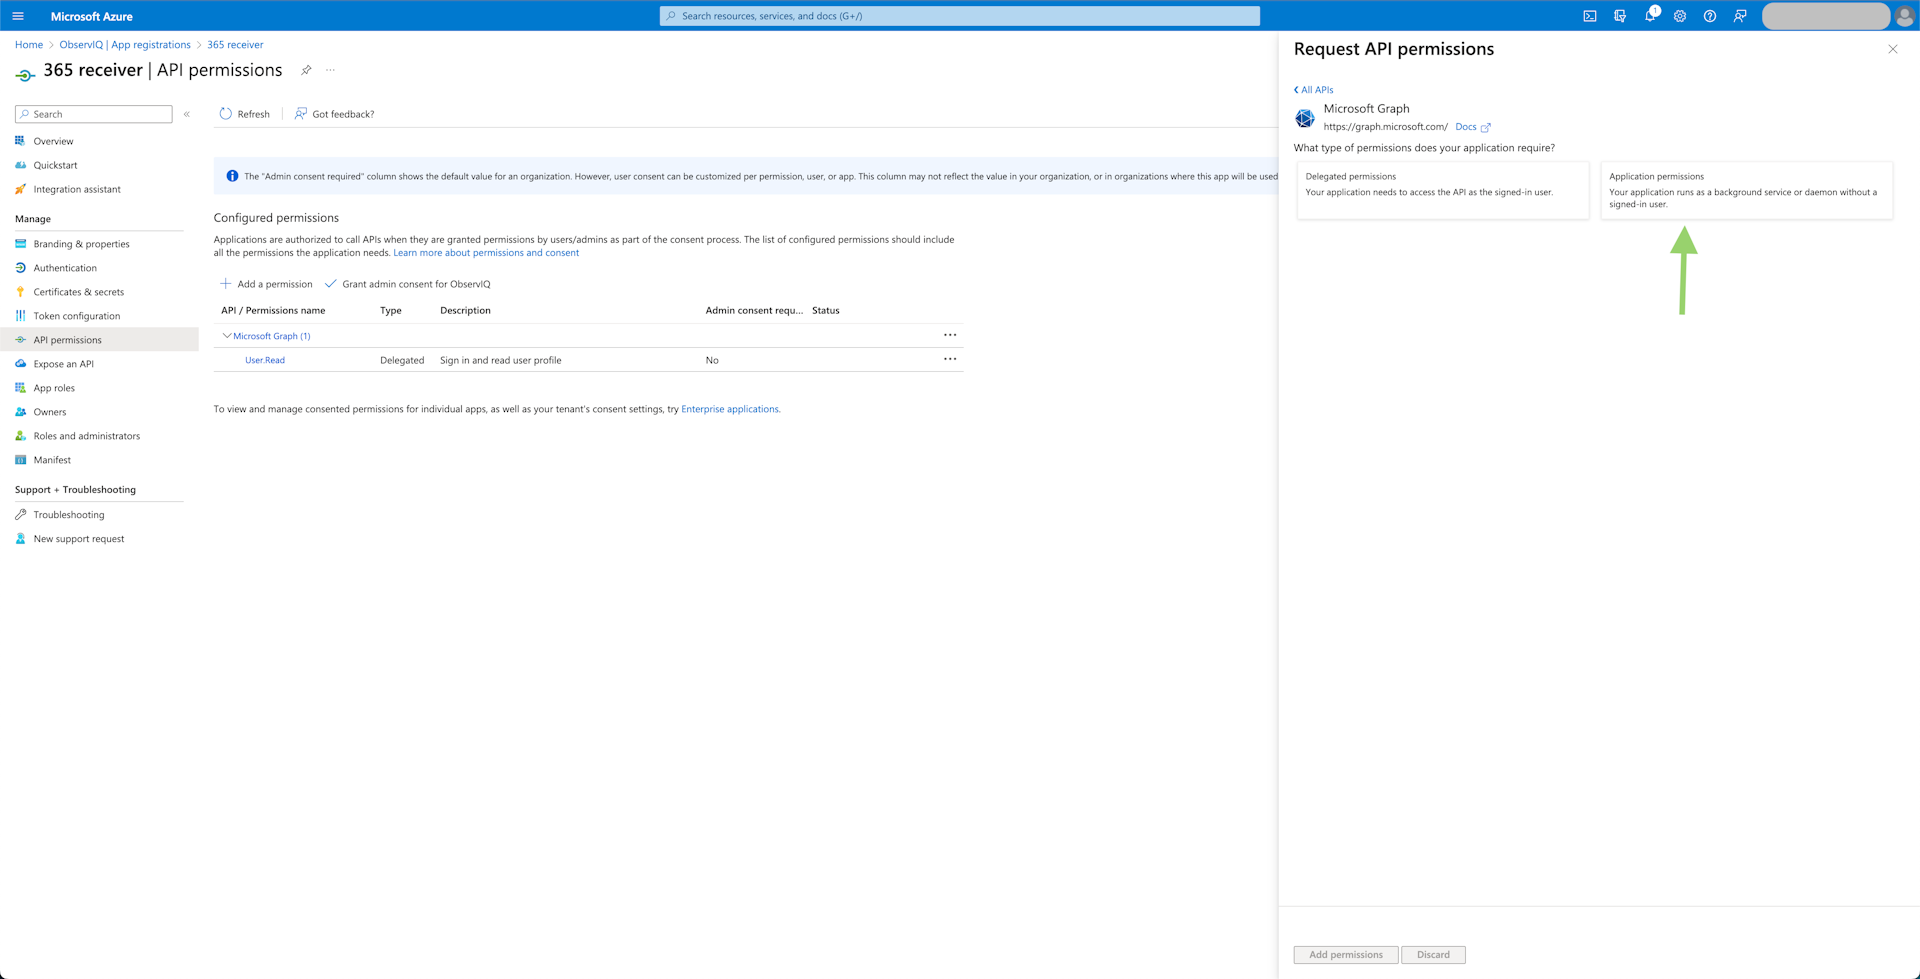
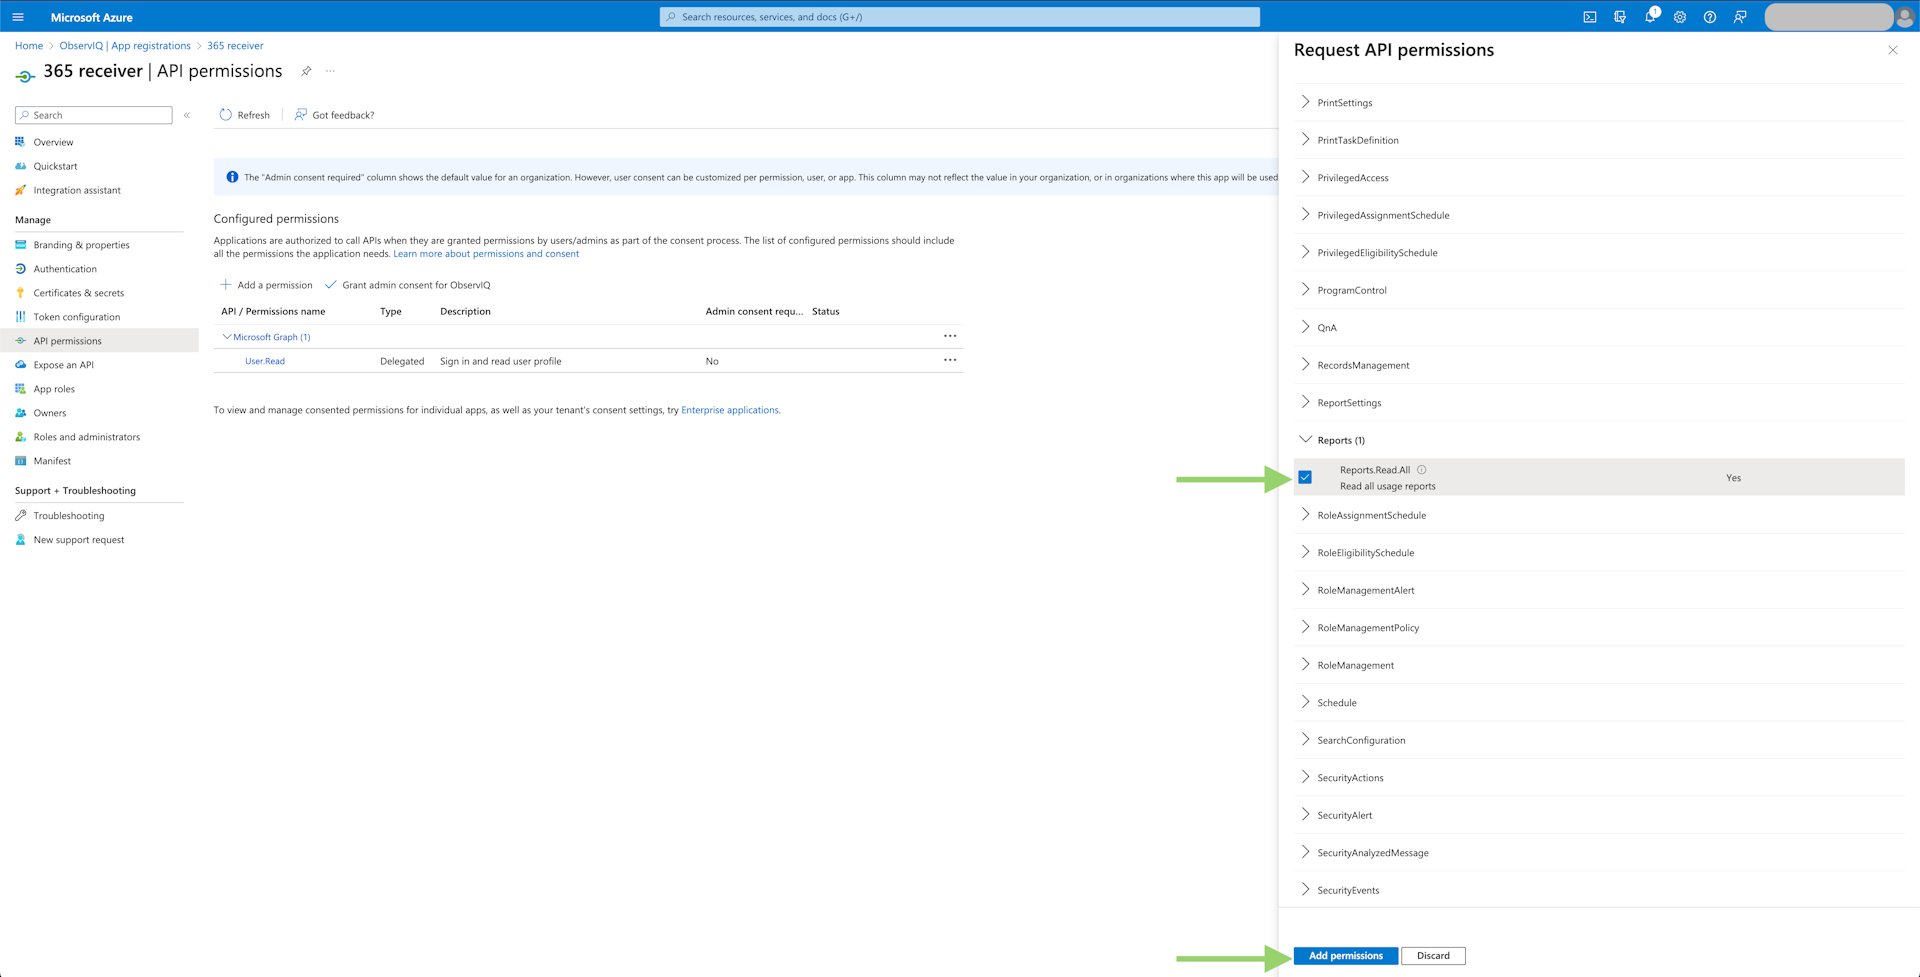
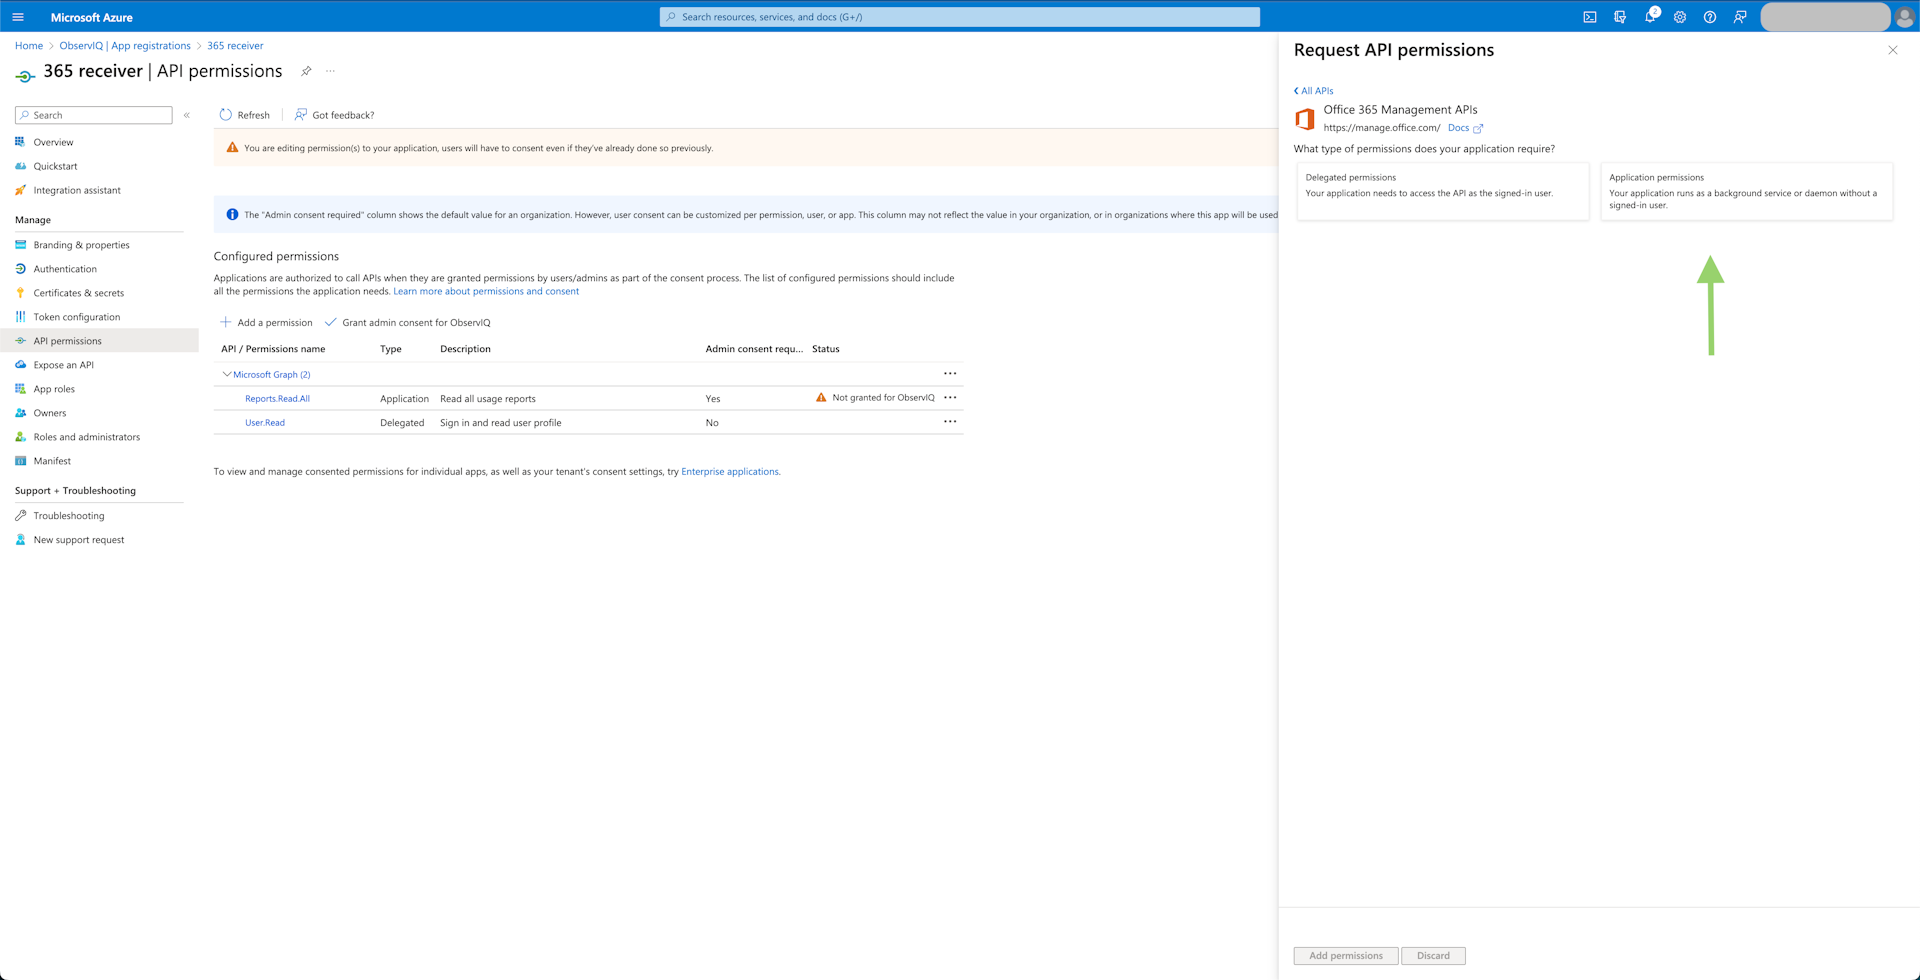
- Metrics: Select "Microsoft Graph", then "Application Permissions". Find the "Reports" tab and select "Reports.Read.All". Click "Add Permissions" at the bottom of the panel.
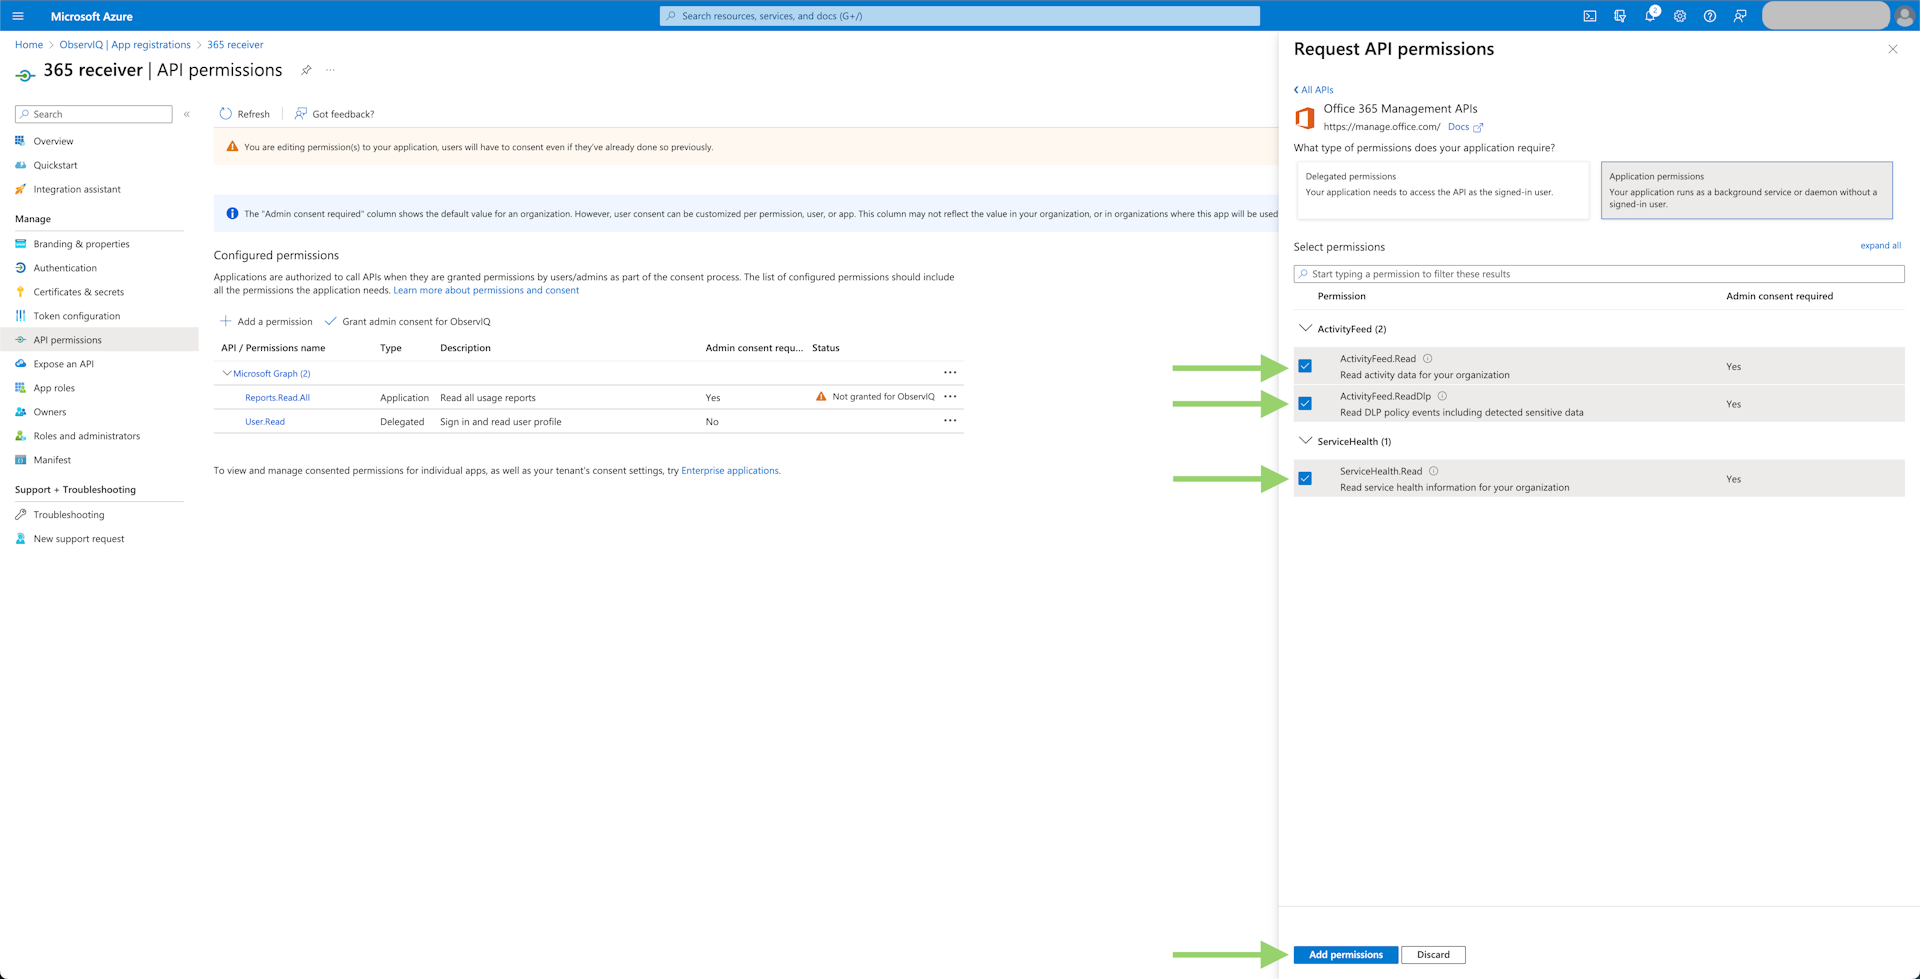
- Logs: Select "Office 365 Management APIs", then "Application Permissions". Now select the "ActivityFeed.Read", "ActivityFeed.ReadDlp", and "ServiceHealth.Read" permissions. Click "Add Permissions" at the bottom of the panel.
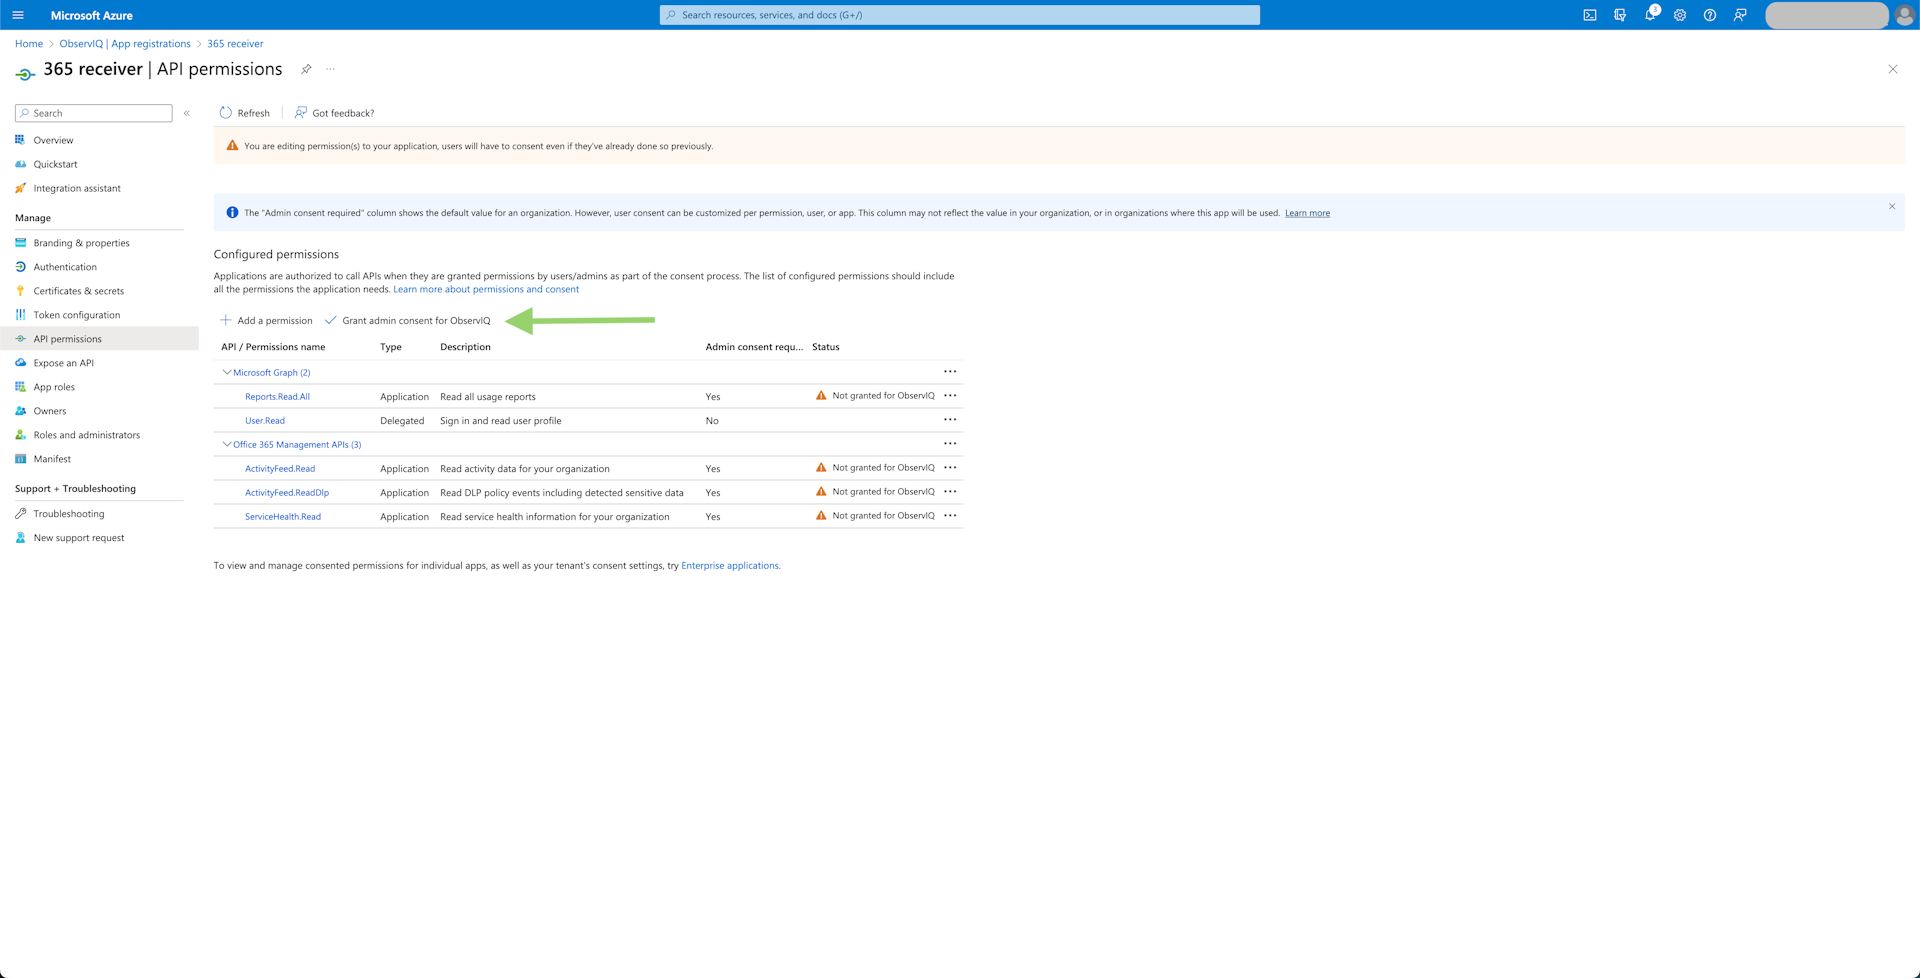
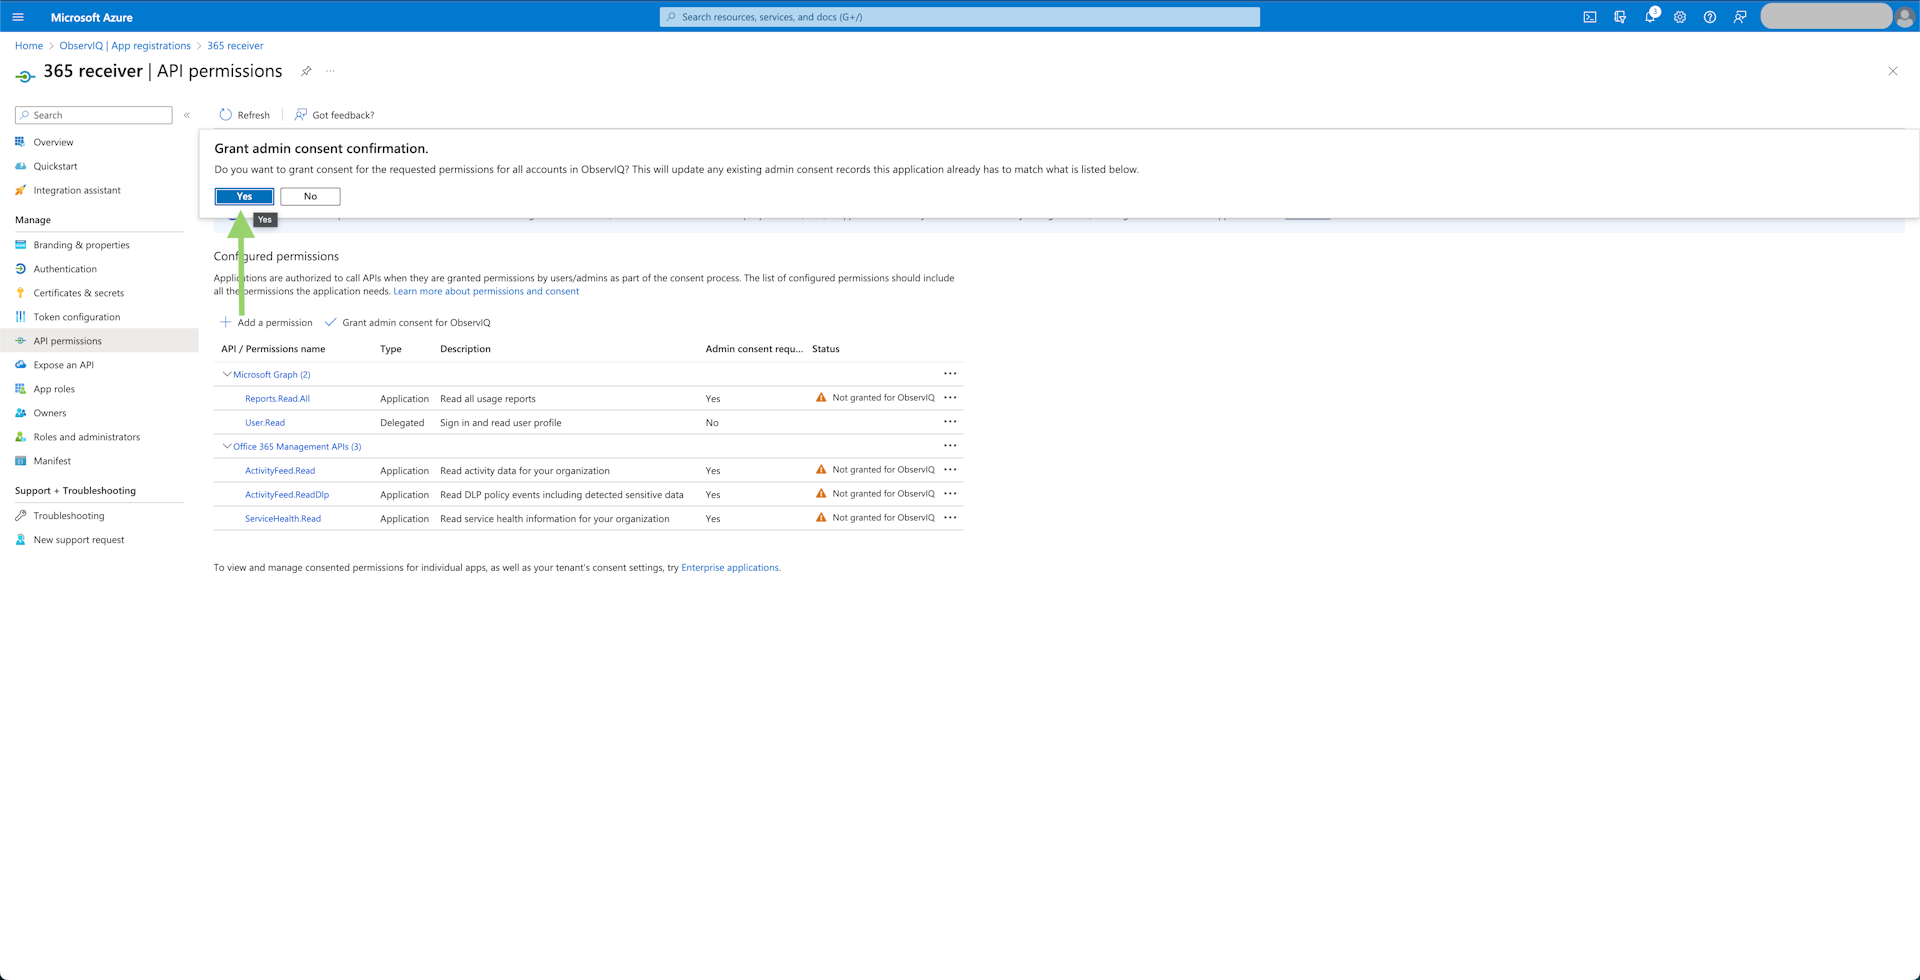
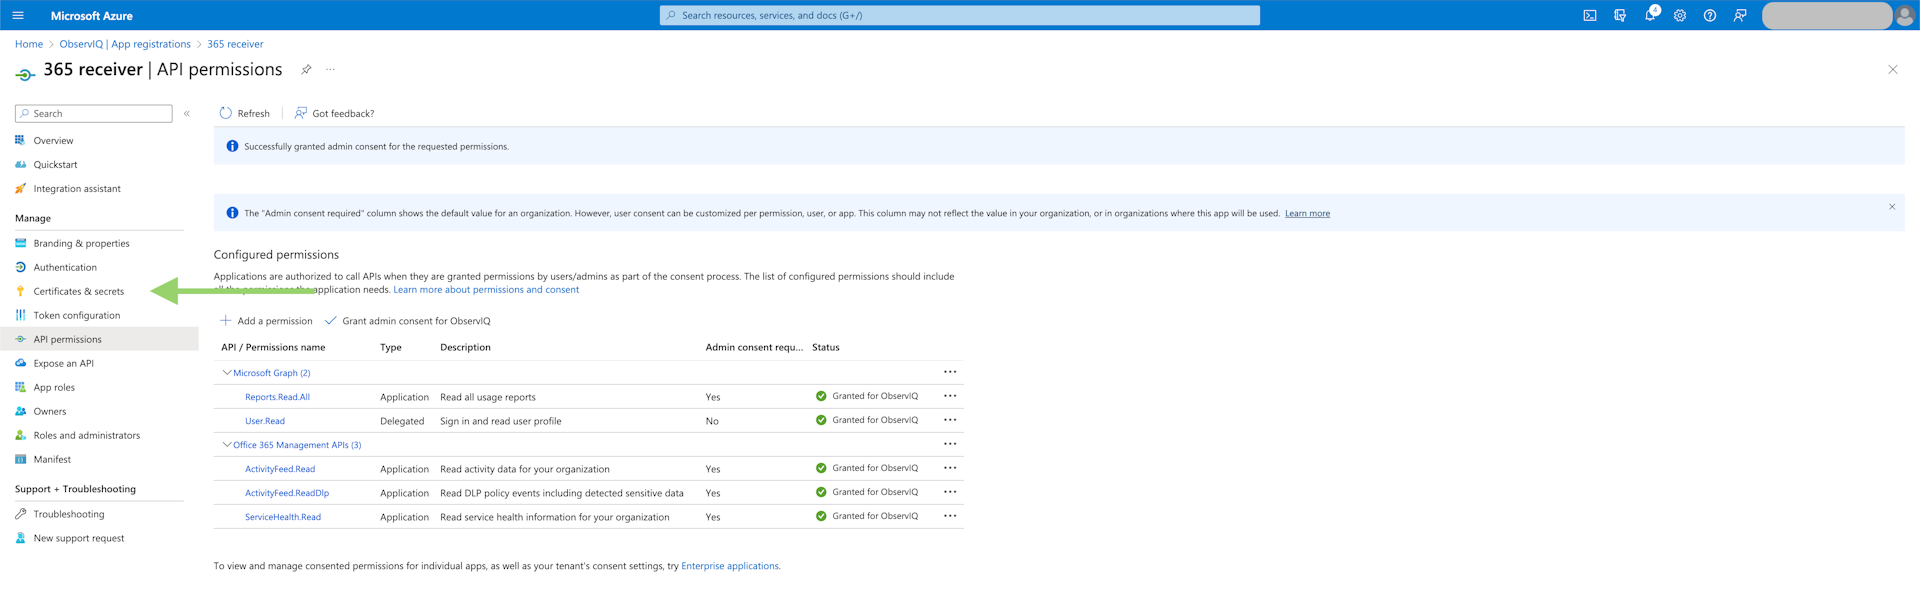
- Grant Admin Consent: Select the "Grant admin consent for
{organization}" button and confirm the pop-up. This will allow the application to access the data returned by the Microsoft Graph and Office 365 Management APIs.
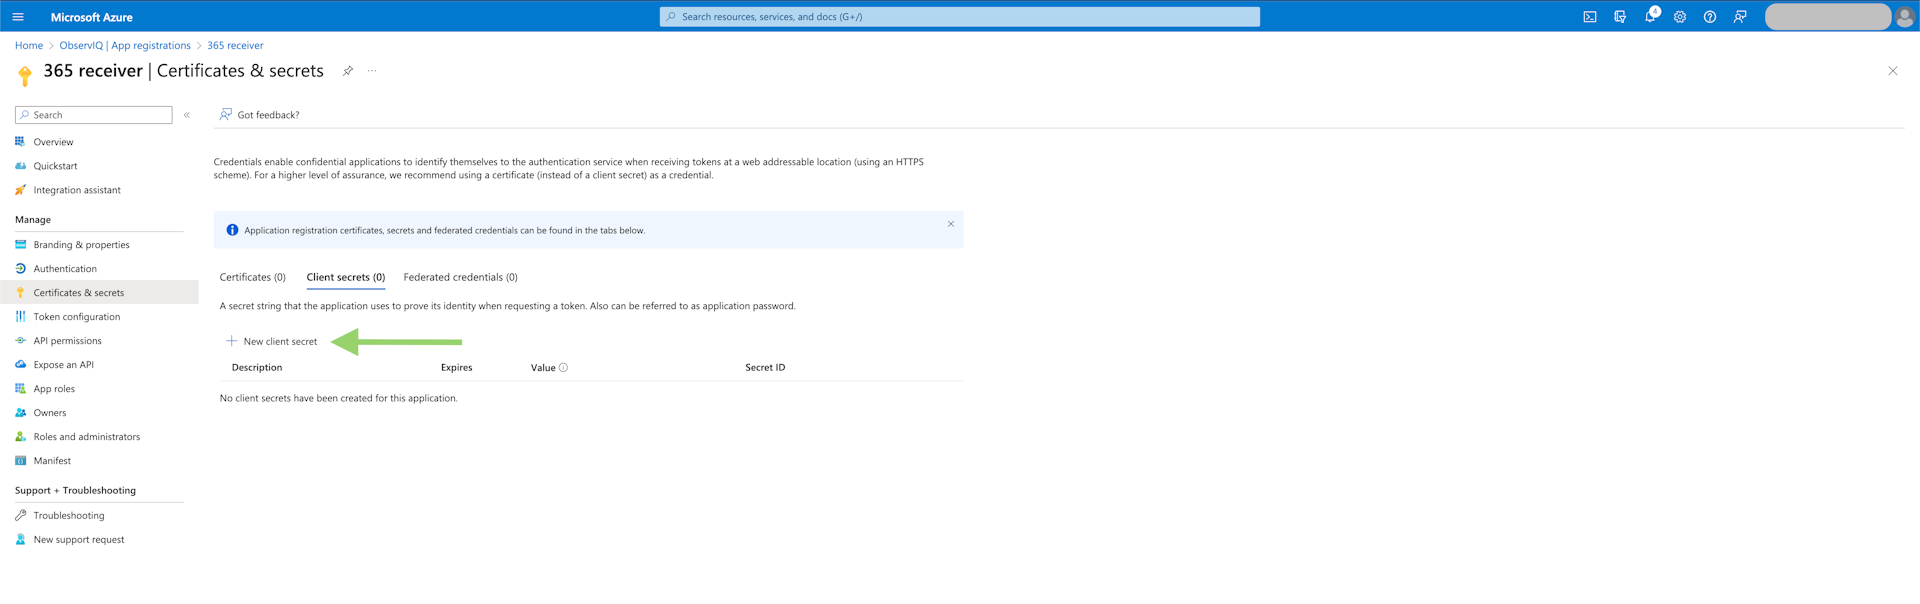
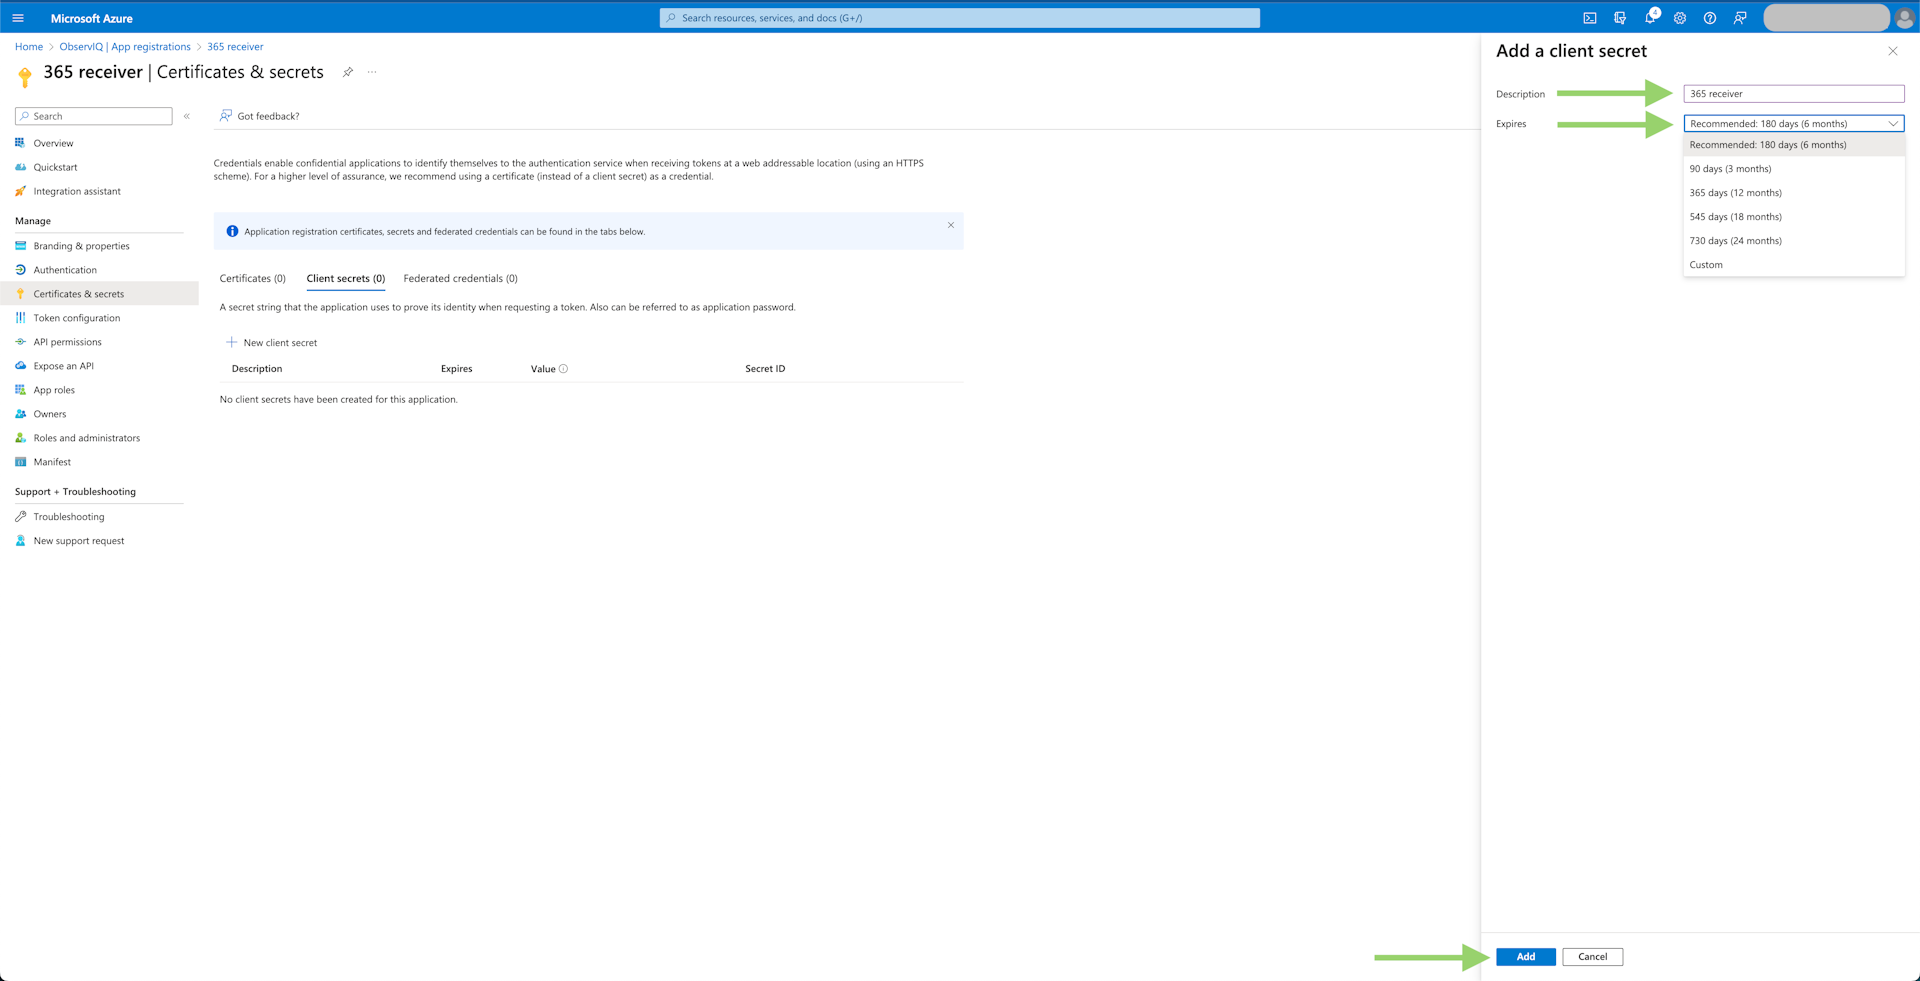
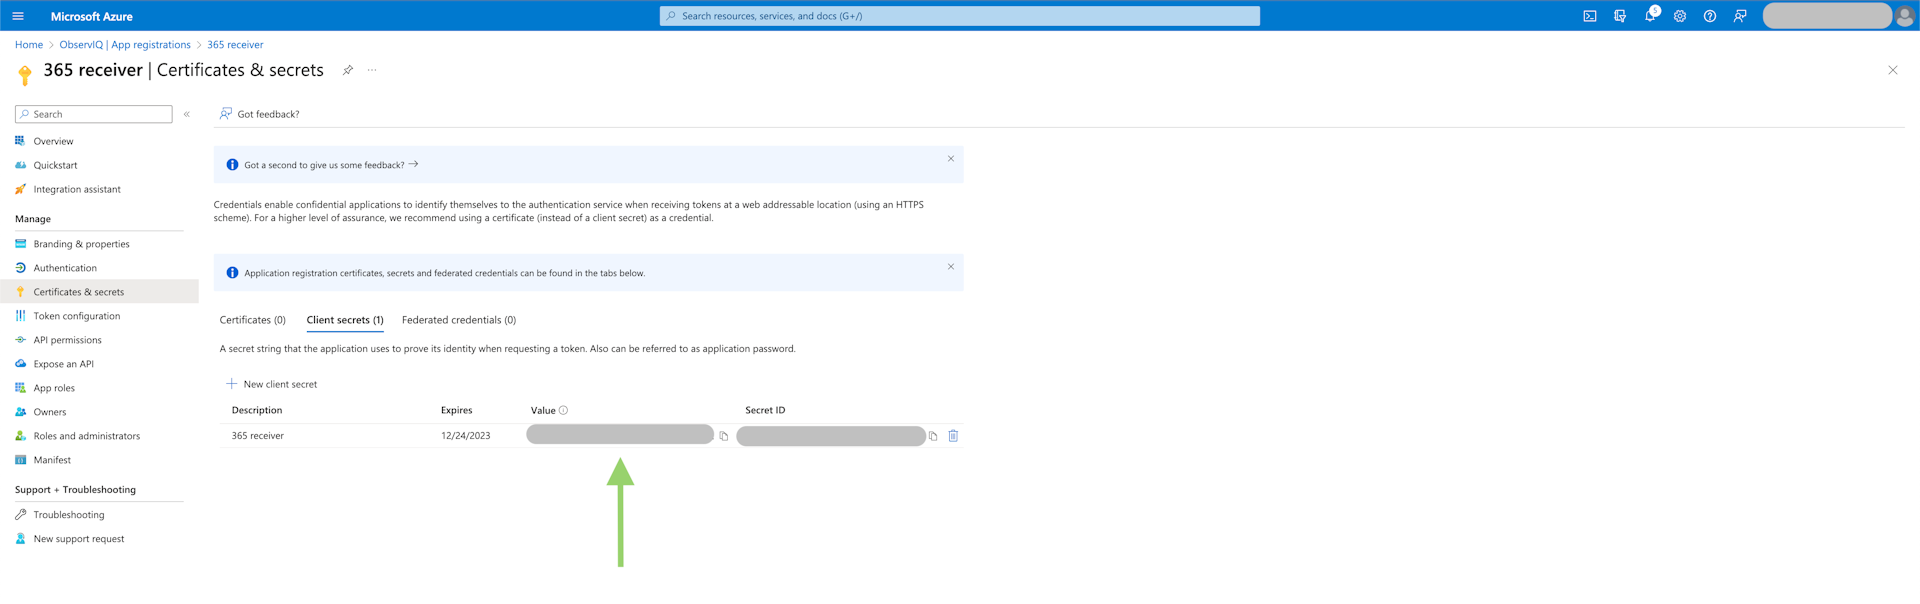
- Generate Client Secret: Select the "Certificates & secrets" tab in the left panel. Under the "Client Secrets" tab, select "New Client Secret." Give it a meaningful description and select the recommended period of 180 days. Save the text in the "Value" column since this is the only time the value will be accessible.
note
The receiver needs be reconfigured with a newly generated Client Secret once the initial one expires.
- Save Client ID and Tenant ID values: You will also need the "client_id" value found on the information page for the application that was created. The value will be listed as "Application (client) id." You will also need the tenant value, which will be listed as "Directory (tenant) id." Save these values for later.
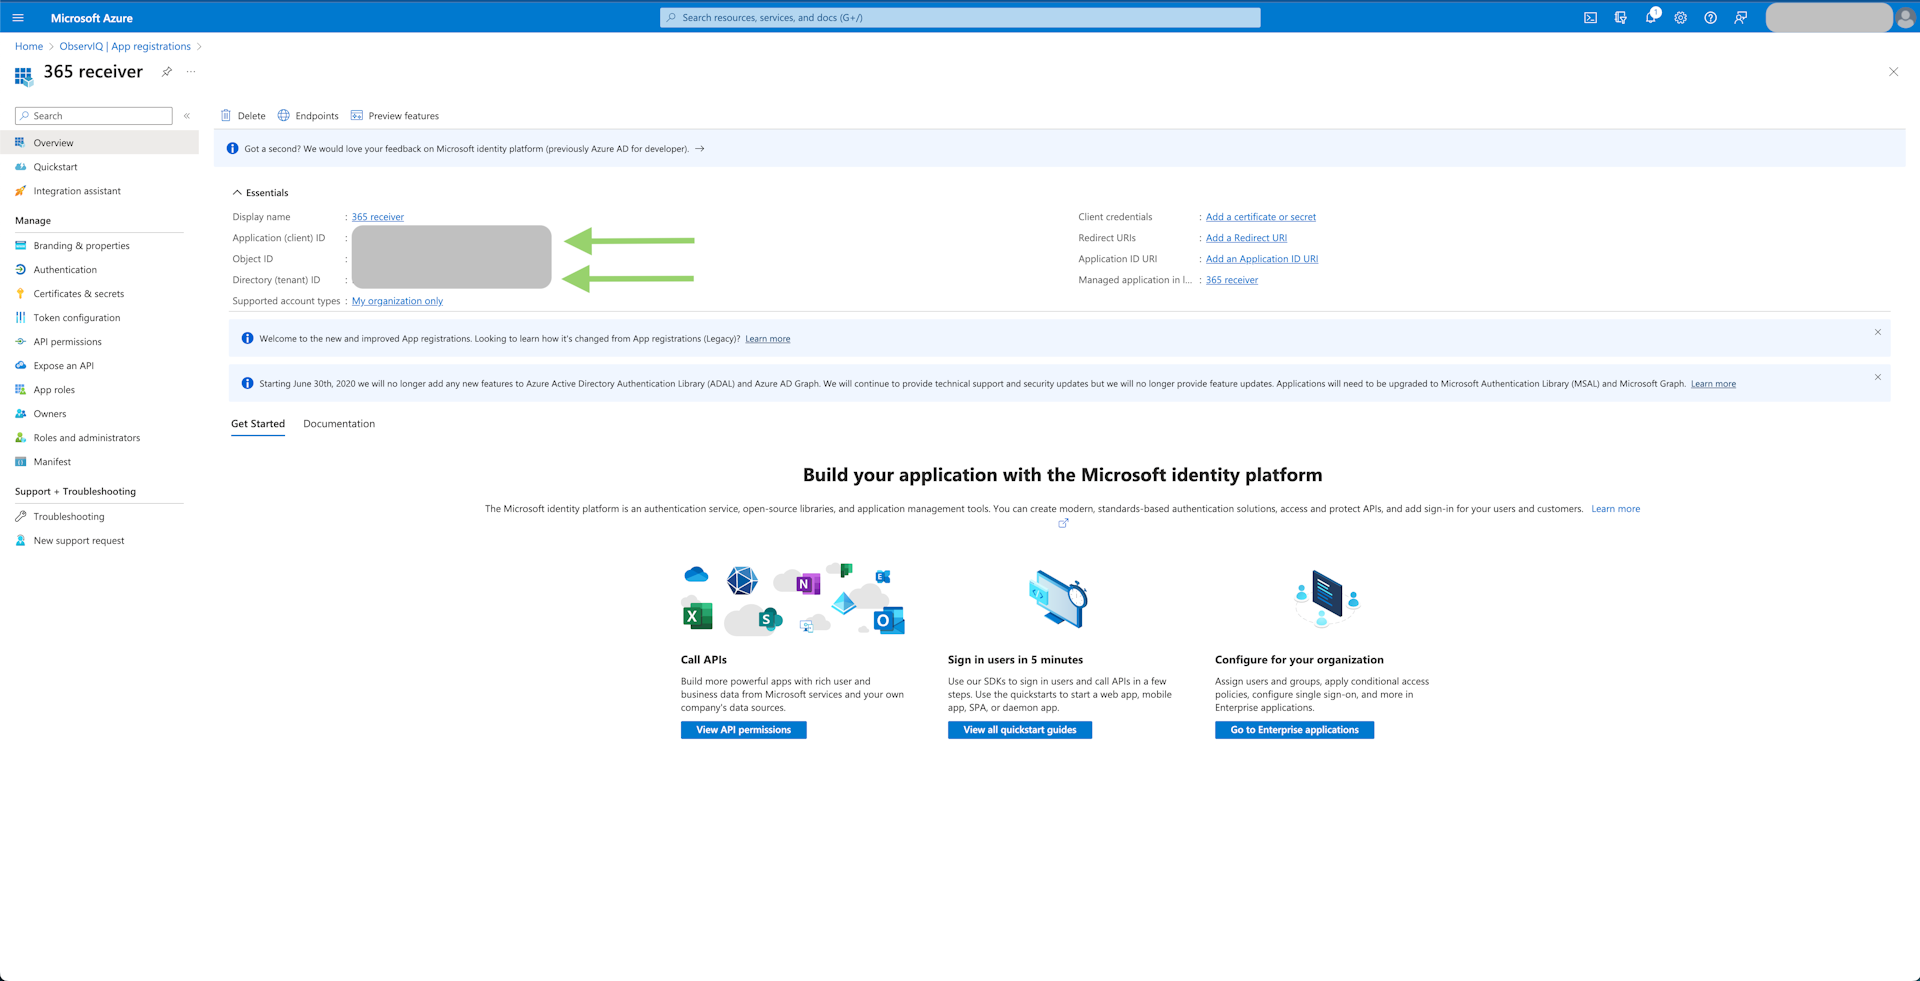
note
The first time an instance of Microsoft 365 is set up for monitoring, an extra step for collecting logs is required.
- Log into Microsoft Purview Compliance Portal with an admin account.
- Navigate to "Solutions" then "Audit".
- If auditing is not turned on for your organization, a banner is displayed prompting you to start recording user and admin activity.
- Select "Start recording user and admin activity".
It will take up to 60 minutes for the change to take effect, so until that point, do not run the receiver with logs turned on, or else it will fail.